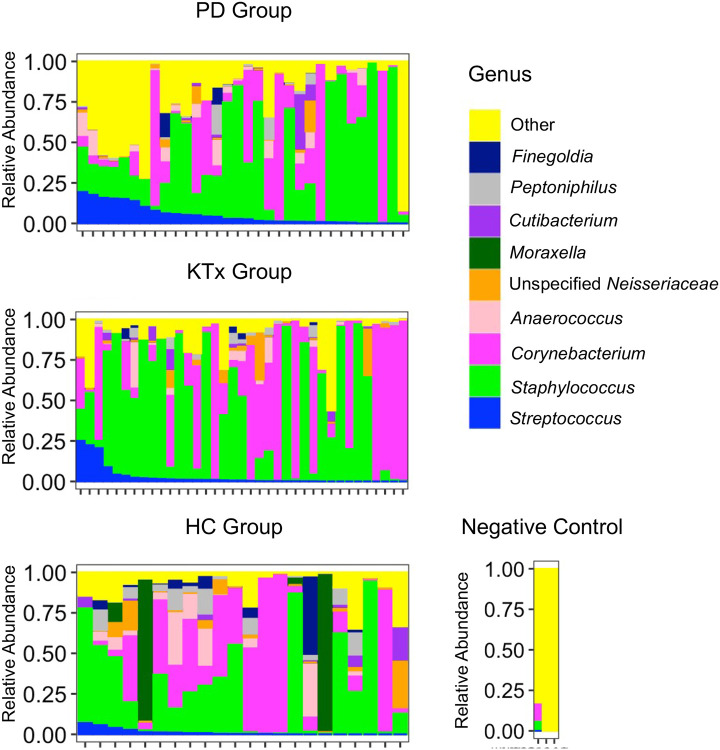
FIGURE 3. Individual Microbiota Profiles by the Study Cohort.
The relative abundance of microbiota is on the y axis and individual nasal specimens are on the x-axis. The relative abundance of each genus is represented by color. The top panel represents anterior nasal microbiota profiles from the 32 peritoneal dialysis (PD) patients, the middle panel represents the anterior nasal microbiota profiles from the 37 kidney transplant (KTx) patients, and the bottom panel represents the anterior nasal microbiota profiles from the 22 potential living donor / healthy control (HC) participants. The right panel represents the microbiota from 3 negative controls.

