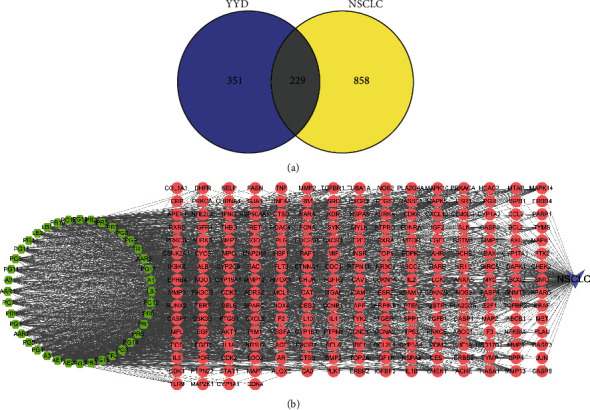
Figure 2.

Identifying the potential targets for YYD against NSCLC. (a) Venn diagram showing the common targets for YYD and NSCLC. (b) The compound-target-disease network of YYD against NSCLC. The green hexagons represent bioactive compounds, the red circles represent targets, and the purple V shapes represent NSCLC.
