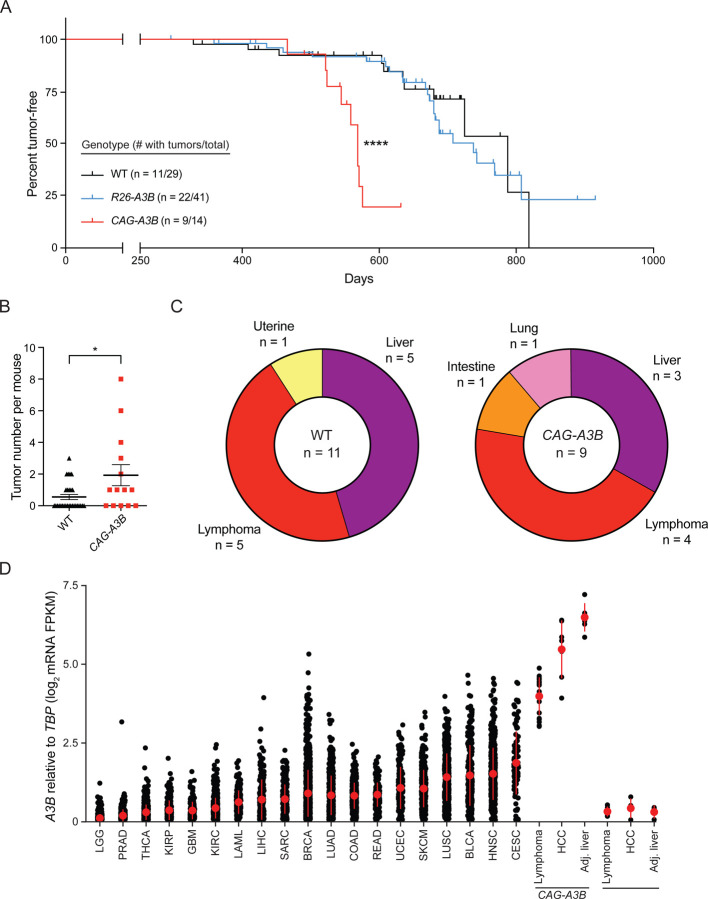
Figure 3. CAG-A3B mice exhibit accelerated rates of tumor progression and elevated tumor numbers.
(A) Kaplan-Meier curves comparing tumor-free survival of WT (n=29), R26-A3B (n=41), and CAG-A3B (n=14) mice (****, p<0.0001 by log-rank Mantel-Cox test). The number of animals with tumors is shown over the total number of animals in each group.
(B) Dot plot of the number of tumors per mouse in each respective genotype (mean +/− SEM; *, p=0.0387 by Mann-Whitney U test).
(C) Pie chart summarizing primary tumor locations in WT and CAG-A3B mice.
(D) A3B mRNA expression levels relative to those of the housekeeping gene TBP for the indicated specimens (single data points show individual values and the median +/− SD is indicated in red for each group). Human tumor RNA-seq data sets are from TCGA, and WT and CAG-A3B data sets are from the indicated tumor and matched normal liver tissues described here (WT lymphoma n=4, HCC n=4, and normal liver n=4; CAG-A3B lymphoma n=18, HCC n=7, and normal liver n=6). See also Figures S2, S3, S4, and Table S1.

