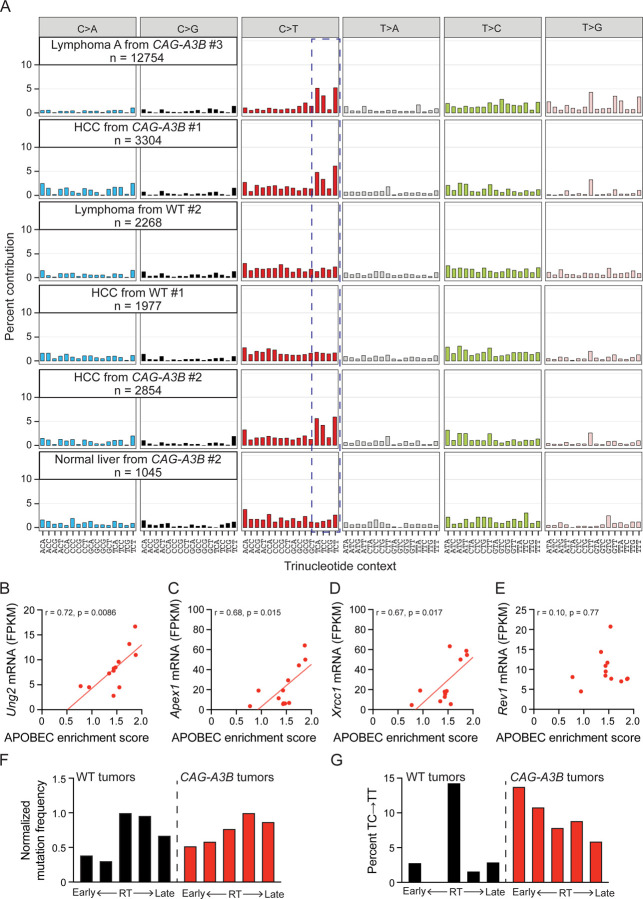
Figure 5: CAG-A3B tumors exhibit APOBEC signature mutations.
(A) Representative SBS mutation profiles for the indicated tumors from WT or CAG-A3B animals (mutation numbers shown). The dashed box highlights APOBEC preferred TC motifs characteristic of SBS2.
(B-E) Scatterplots of APOBEC enrichment score from CAG-A3B lymphomas (n=12) compared to the mRNA levels of Ung2, Apex1, Xrcc1, and Rev1, respectively, from the same tumors (Pearson correlation coefficients and corresponding p-values indicated).
(F) Bar plots showing the proportion of mutations in WT and CAG-A3B tumors according to early-to late-replicating regions (mutation numbers normalized to the largest quintile in each group).
(G) Bar plots showing the percent of TC-to-TT mutations as a percent of all mutations in each quintile in panel F.
See also Figures S7, S8, S9, S10, and S11.

