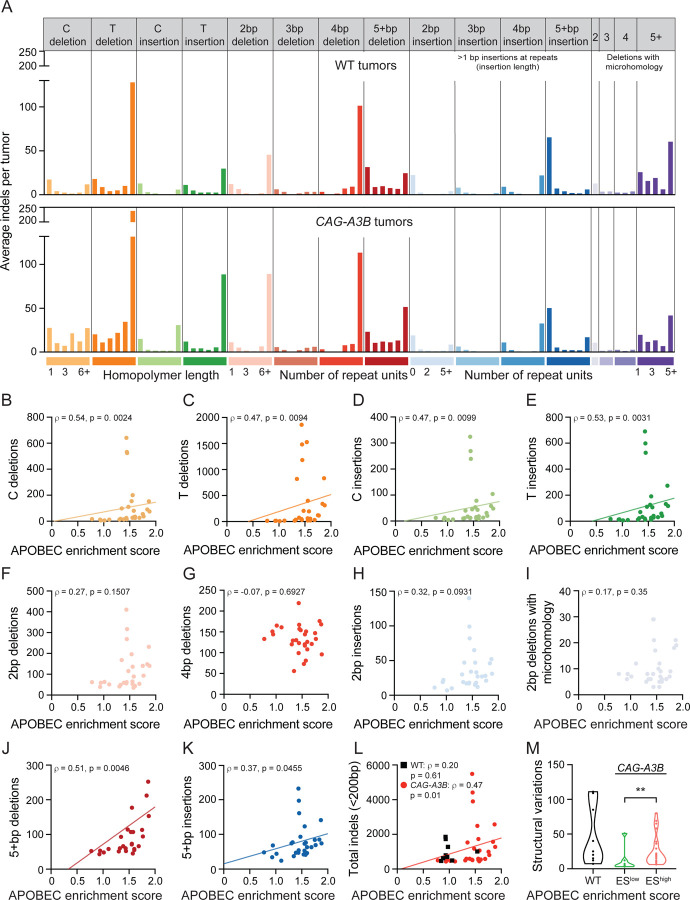
Figure 6. Hypermutated CAG-A3B tumors also exhibit higher frequencies of a range of structural variations.
(A) Composite spectrum of the average number of small insertion/deletion mutations in tumors from WT (n=9) and CAG-A3B (n=29) animals.
(B-K) Scatterplots showing relationships between APOBEC enrichment scores from CAG-A3B tumors and the indicated indel types (Spearman’s rank correlation coefficients and corresponding p-values indicated).
(L) Scatterplots showing the relationship between APOBEC enrichment scores from WT (black) and CAG-A3B (red) tumors and the total number of indels <200bp in each tumor (Spearman’s rank correlation coefficients and corresponding p-values indicated).
(M) Violin plots of the total number of structural variations in tumors from WT mice in comparison to tumors from CAG-A3B animals with low or high APOBEC enrichment scores (ES; p=0.0087 for EShigh vs ESlow groups by Mann-Whitney U test).
See also Figures S7, S10, and S12.

