
FIGURE 2.
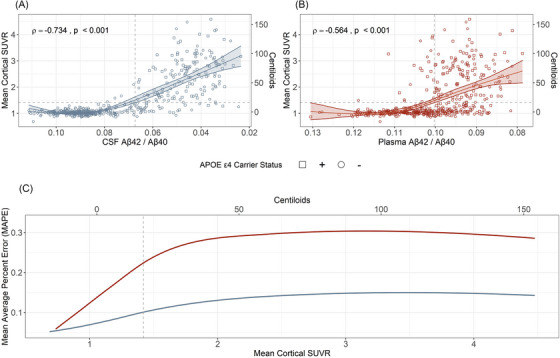
Correlations of amyloid positron emission tomography (PET) with cerebrospinal fluid (CSF) and plasma amyloid beta (Aβ)42/Aβ40. The relationship of amyloid PET with CSF Aβ42/Aβ40 (A) or plasma Aβ42/Aβ40 (B) is shown with Spearman correlations. Horizontal dashed lines denote the established cutoff for amyloid PET (standardized uptake value ratio [SUVR] 1.42). The line of best fit for (A) and (B) was determined using a generalized additive model (GAM) with bootstrapped confidence intervals (Cis). The mean average percent error (MAPE) associated with the GAM model fit for the previous 50 values is shown (C). For low amyloid PET values, the MAPE is low (good prediction) for both CSF Aβ42/Aβ40 (blue) and plasma Aβ42/Aβ40 (red). As amyloid burden increases, the sliding window MAPE increases more rapidly for the plasma Aβ42/Aβ40 GAM than the CSF Aβ42/Aβ40 GAM. A vertical line shows the established cutoff for amyloid PET positivity.