Fig. 3.

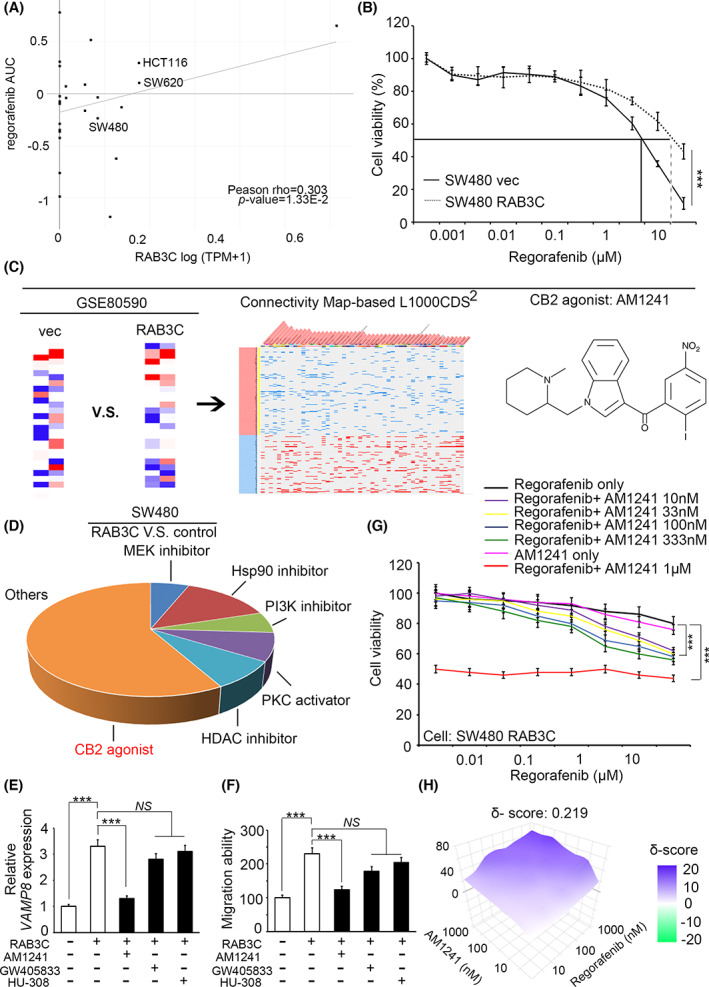
Synergy of regorafenib and CB2 agonists in the RAB3C overexpression model of CRC. (A) Correlation plot showing the relationship between RAB3C‐expression level (Expression 21Q4 public) and the IC50 of regorafenib (BRD:BRD‐K16730910‐001‐10‐7) from the DepMap portal website. Pearson r = 0.303; P‐value = 0.0133. (B) Cell viability of regorafenib treatment in RAB3C‐expression model in SW480 cells. (C) Flowchart of candidate drug screening and prediction through integrated signatures of transcriptomics from the Connectivity website (https://maayanlab.cloud/L1000CDS2/#/index). (D) Potential compound candidates predicted by SW480 RAB3C‐overexpression transcriptomic profiles from the L1000 website. (E) qRT‐PCR analysis of VAMP8 with or without treatment with CB2 agonists in RAB3C‐expression model. (F) Detection of migration ability with or without treatment with CB2 agonists in the RAB3C‐expression model. (G) Cell viability under treatment of regorafenib alone or combined with various dosages of CB2 agonist AM1241 (10 nm–1 μm) in the SW480 RAB3C‐overexpression model. (H) Synergy calculation of combined use of regorafnib and AM1241 through SynergyFinder service (synergy score (δ‐score) < 10: antagonistic; −10 ~ 10: additive; > 10: synergistic). ***P < 0.001, NS, not significant. Data are presented as the mean ± standard error of the mean. Student's t‐test was used for the comparison of measurable variants of two groups. All experiments (B/E) were performed with at least three biological duplicates (n = 3) for each group, in triplicate.
