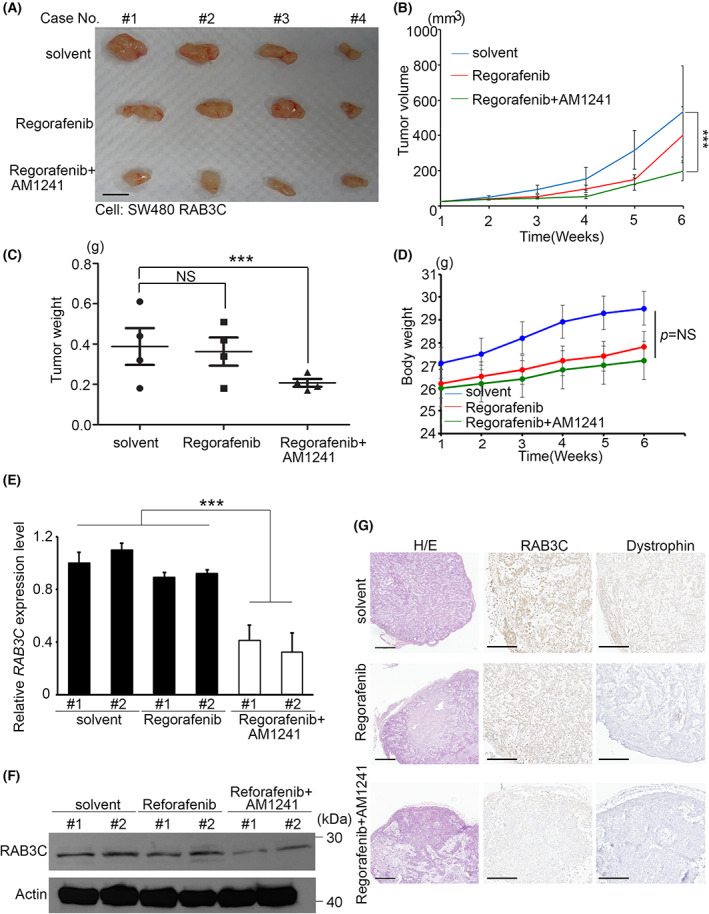
Fig. 4.

Synergistic effect of regorafenib and CB2 agonists in vivo. (A) Overview of solid tumor response to regorafenib alone or regorafenib combined with AM1241 compared with control group in vivo. Scale bar: 1 cm. (B) Tumor growth curve of solvent control, regorafenib alone, and regorafenib combined with AM1241 in vivo. (C) Quantitation of tumor weights in mice with solvent, regorafenib alone, and regorafenib combined with AM1241 treatments (P = 0.019). (D) Bodyweights of mice treated with solvent, regorafenib alone, and regorafenib combined with AM1241 in vivo. (E) qRT‐PCR analysis of RAB3C in solid tumors of mice treated with solvent, regorafenib alone, and regorafenib combined with AM1241. (F) Western blot analysis of RAB3C protein expression in solid tumors of mice treated with solvent, regorafenib alone, and regorafenib combined with AM1241. We used regorafenib at a concentration of 10 μm in this study, and at a concentration of 1 μm for AM1241. (G) Representative images of dystrophin/RAB3C protein staining and H/E staining results in xenograft models. We used paired t‐tests to analyze statistical significance in control and regorafenib groups. Scale bar: 500 μm. ***P < 0.001, NS, not significant. Data are presented as the mean ± standard error of the mean. Student's t‐test was used for the comparison of measurable variants of two groups. All experiments were performed with at least three biological duplicates (n = 3) for each group, in triplicate.
