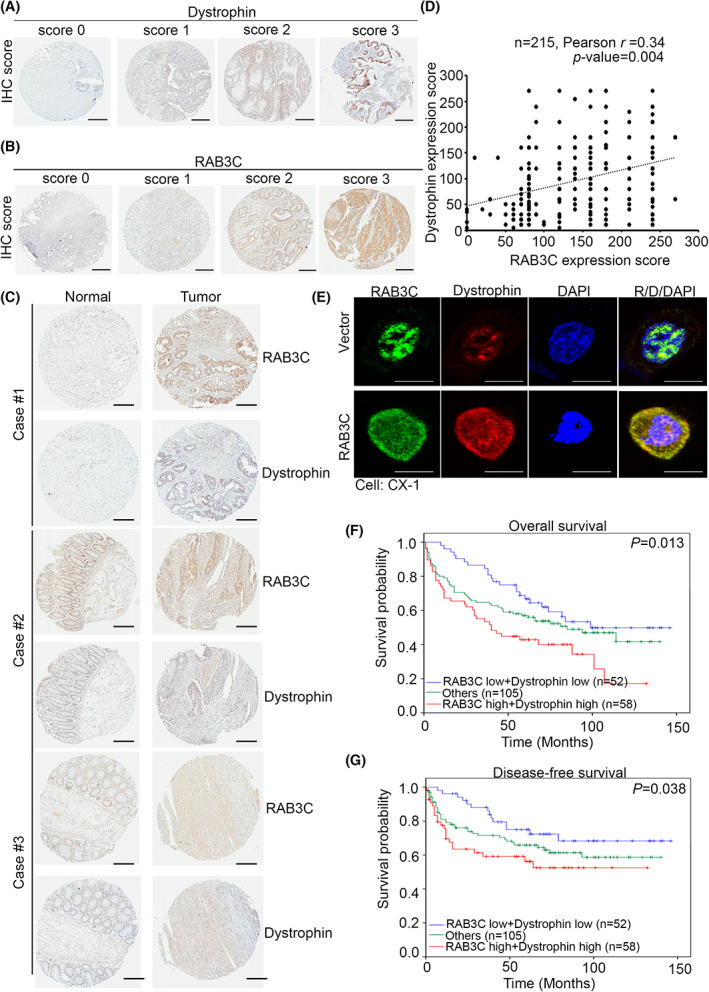
Fig. 5.

Combined RAB3C and dystrophin serve as an independent indicator of poor prognosis, distant metastasis, and advanced stage in CRC patients. (A) Scores indicating dystrophin levels in representative colorectal tumor tissues from 0 to 3. Scale bar: 300 μm. (B) Scores indicating RAB3C levels in representative colorectal tumor tissues from 0 to 3. Scale bar: 300 μm. (C) Representative image of dystrophin/RAB3C‐protein‐staining results in normal adjacent tissue/tumor pairs of patients. Scale bar: 300 μm. (D) Correlation statistics between RAB3C and dystrophin protein in CRC tissue microarray (n = 215; Pearson's r = 0.34; P = 0.004). (E) Representative fluorescent images of dystrophin/RAB3C‐protein‐staining results in RAB3C‐expression model in CX‐1 cells. Scale bar: 10 μm. (F) Kaplan–Meier curves of overall and (G) disease‐free survival of 215 patients with CRC, stratified by high or low RAB3C, combined with dystrophin protein expression levels (P = 0.013 and P = 0.038, respectively). “Others” include RAB3C high + dystrophin low group and RAB3C low + dystrophin high group. All experiments were performed with at least three biological duplicates (n = 3) for each group, in triplicate.
