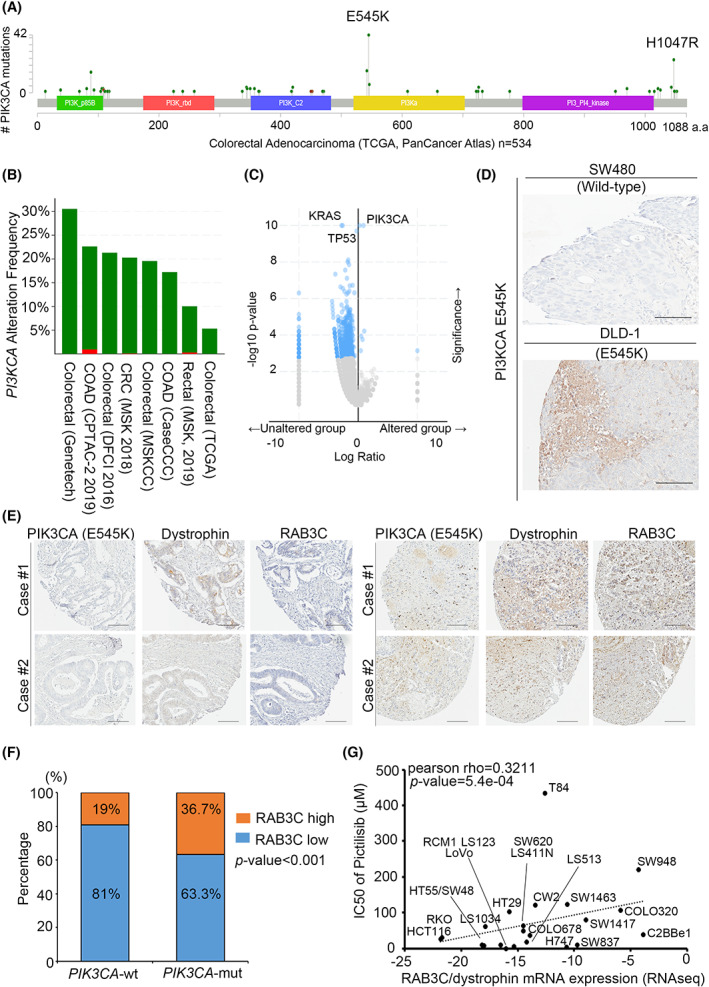
Fig. 6.

RAB3C expression level is correlated with genetic events of PIK3CA/KRAS in CRC patients. (A) Protein domains of PIK3CA and its mutation sites in colorectal adenocarcinoma patients from TCGA clinical cohort (n = 534) from GEPIA. (B) Bar graph showing frequency of PIK3CA alterations in various clinical cohorts. Green: gene mutation. Red: amplification. (C) Ranking of genetic modification events in colon cancer cohorts. (D) Representative image of PIK3CA E545K mutant protein staining results in colon cancer cells. (E) Representative image of dystrophin/RAB3C/PIK3CA E545‐protein‐staining results in clinical specimens. (F) Percentage of RAB3C‐expression levels in PIK3CA wildtype and mutant groups, respectively (wt: PIK3CA gene is wildtype; mut: PIK3CA gene mutation). (G) Correlation plot of IC50 of pictilisib with RAB3C/dystrophin mRNA expression levels in colon cancer cell lines. Scale bar: 300 μm. All experiments were performed with at least three biological duplicates (n = 3) for each group, in triplicate.
