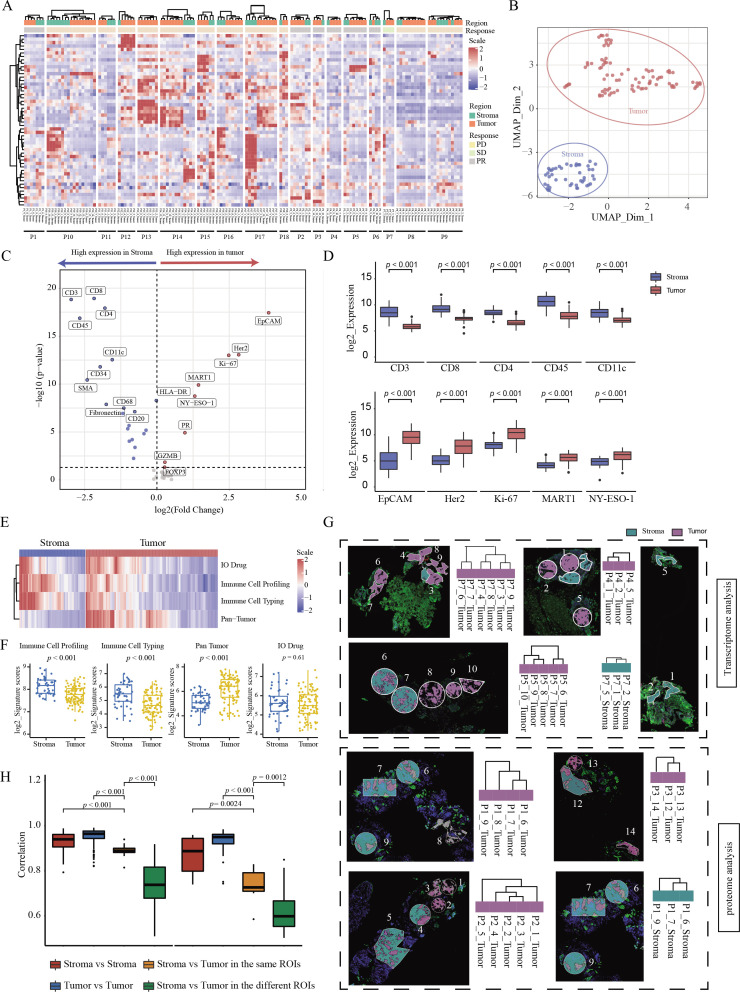
Figure 2.
Distinct expression patterns of intratumoral spatially distinct AOIs identified by DSP (A) Heatmap of target proteins in different spatial regions of each patient. The region of AOIs for each patient is shown in the top track. The clinical response for each patient is shown under the track of the region. The protein expression from each AOI is shown in the central heatmap. The corresponding region and patient for each AOI are shown under the central heatmap. (B) UMAP of dimensionality reduction analysis at the protein level. (C) Volcanic map of differentially expressed proteins in different regions. (D) Box plot of top five differential proteins within different spatial regions. (E) Heatmap of DSP protein panels about pan-tumor, immune cell profiling, immune cell typing, and IO drug in different regions. (F) Scatter plot of DSP protein panels in different regions. (G) Comparison between spatial distance of different ROIs in one sample and molecular clustering results from transcriptome and proteome images. The top four and bottom four images with spatially adjacent AOIs are from the DSP RNA and protein assay, respectively. The cluster maps of AOIs on the side of the images were based on the expression level of RNA or proteins, respectively. (H) Correlation comparisons of stroma or tumor regions in the same or different ROIs. AOI, area of interest; DSP, digital spatial profiling; PD, progressive disease; PR, partial response; ROI, region of interest; SD, stable disease.

