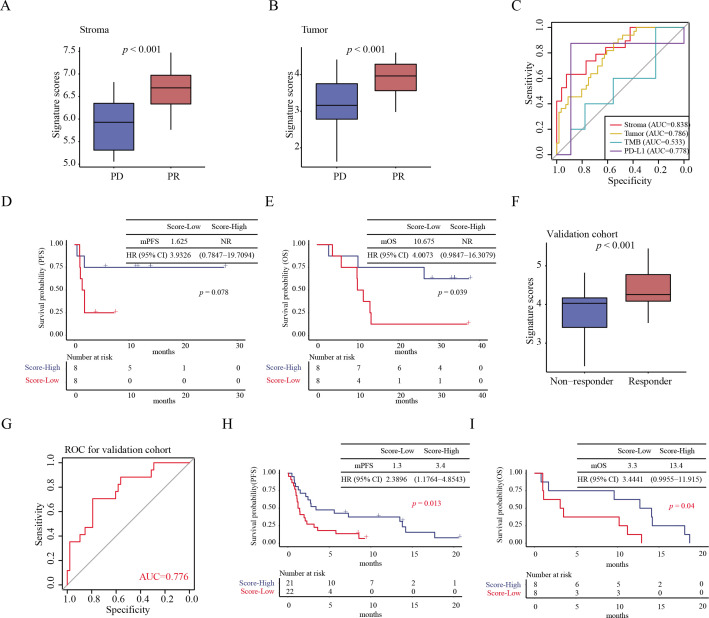
Figure 5.
Construction of a spatially resolved signature to predict clinical response to immunotherapy. Boxplot of signature scores from stromal (A) and tumor regions (B) between different response groups. (C) ROC curves of efficacy prediction of constructed signatures in the stromal, tumor regions, as well as traditional biomarkers PD-L1 and TMB. (D) Survival curves of the PFS prognostic value of the stroma signature. (E) Survival curves of the OS prognostic value of the stroma signature. (F) Box plot of efficacy prediction of signature constructed by genes corresponding to differential proteins between different response groups in a validation cohort. (G) ROC of gene signature in the validation cohort. (H) Survival curves showed the PFS prognostic value of gene signature in validation cohort. (I) Survival curves showed the OS prognostic value of gene signature in validation cohort. mPFS, median progression-free survival; NR, not reached; OS, overall survival; PD, progressive disease; PD-L1, programmed death ligand-1; PFS, progression-free survival; PR, partial response; ROC, receiver operating characteristic; TMB, tumor mutation burden.

