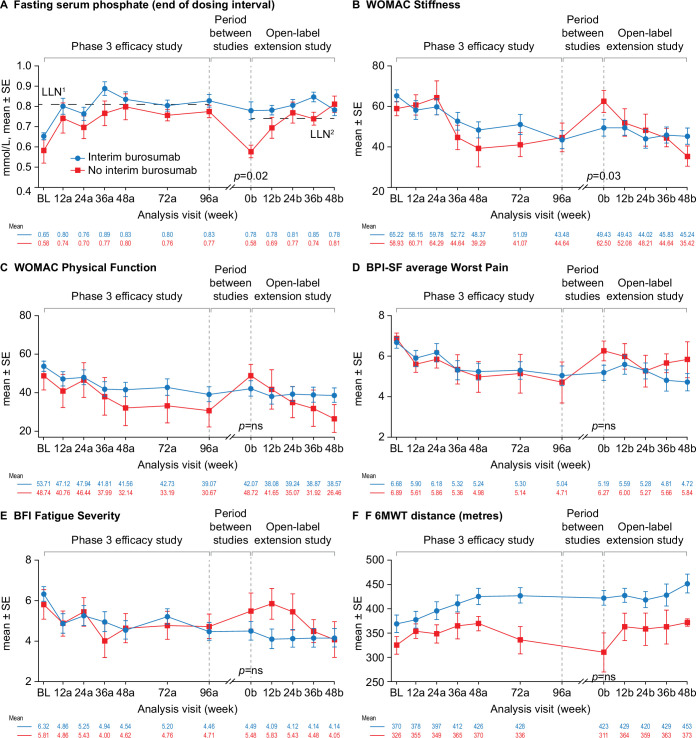
Figure 4.
Effect of burosumab treatment interruption on serum phosphate, PROs and 6MWT. Interim burosumab, n=23; no interim burosumab, n=7. Analysis weeks in the phase 3 study and open-label extension are indicated by ‘a’ and ‘b’ suffixes, respectively. A decrease in scores indicates improvement on the WOMAC, BPI-SF and BFI. An increase in distance on the 6MWT indicates improvement. BPI-SF and BFI data were captured at a single site visit and were not completed as part of a patient diary at weeks 72a and 96a. Fasting serum phosphate p values are for the difference between the groups (end of dosing cycle) at week 0b (tested using Fisher’s exact test); 52% of the interim burosumab group but none of no interim burosumab group had values ≥LLN at the start of the open-label extension period (p=0.01; Fisher’s exact test). PROs and 6MWT (tested using the Mann-Whitney U test) p<0.05 was considered significant. There was no significant difference between the groups at study baseline. Serum phosphate samples from the two studies were measured at different central laboratories, with different LLN values: 0.81 mmol/L in the phase 3 study (LLN1) and and 0.74 mmol/L in the open-label extension (LLN2). BFI, Brief Fatigue Inventory; BL, baseline; BPI-SF, Brief Pain Inventory short-form; LLN, lower limit of normal range; 6MWT, 6-Minute Walk Test; PRO, patient-reported outcome; WOMAC, Western Ontario and McMaster Universities Osteoarthritis Index.

