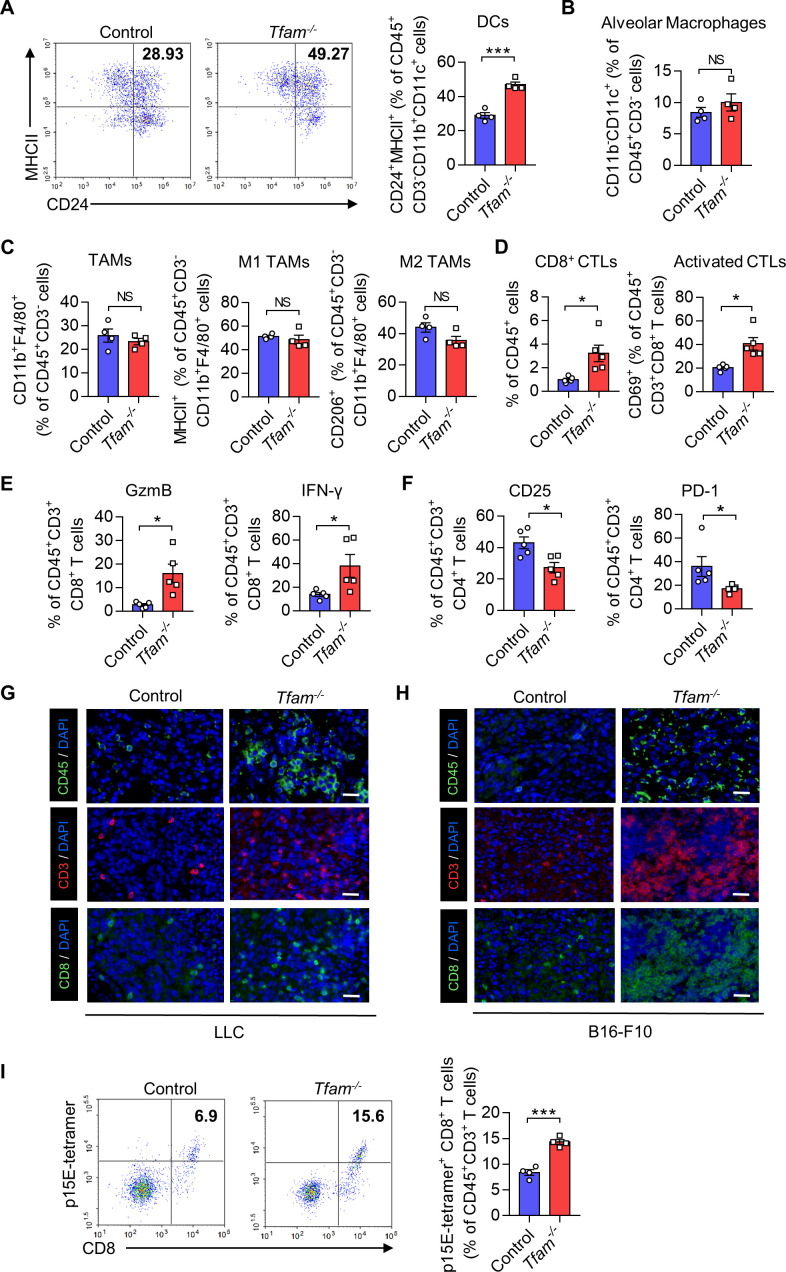
Figure 2.
TFAM deletion in myeloid transforms tumor immune microenvironment and increases lymphocyte infiltration. (A–F) LLC cells (5×10⁵) were intravenously injected into control or Tfam-/- mice to establish experimental pulmonary metastasis models. Mice were sacrificed on day 24 to collect the lungs. Then the single-cell suspension of the whole lungs with metastatic tumors was prepared and subjected to FCM analysis. (A) Representative scatterplots of the gated DCs (CD45+ CD3- CD11b+ CD11c+ MHCII+ CD24+) are shown in the left panel and quantified in the right panel (n = 4 mice). (B) The percentages of alveolar macrophages (CD45+ CD3- CD11b- CD11c+) are quantified (n = 4 mice). (C) The percentages of TAMs (CD45+ CD3- CD11b+ F4/80+), M1 TAMs (CD45+ CD3- CD11b+ F4/80+ MHCII+), and M2 TAMs (CD45+ CD3- CD11b+ F4/80+ CD206+) are quantified (n = 4 mice). (D) The percentages of CD3+ CD8+ CTLs gated from CD45+ cells (left panel) and activated CD69+ CTLs gated from CD45+ CD3+ CD8+ (right panel) are quantified (n=5 mice). (E) The percentages of GzmB+ or IFN-γ+ T cells are quantified. Cells are gated from CD45+ CD3+ CD8+ subpopulation (n=5 mice). (F) The percentages of CD25+ or PD-1+ T cells are quantified. Cells are gated from CD45+ CD3+ CD4+ subpopulation (n=5 mice). (G, H) Immunofluorescence staining of CD45 (green), CD3 (red), CD8 (green) and DAPI (blue) in lungs of the mice from pulmonary metastasis models of LLC (G) or B16-F10 (H). Scale bars represent 20 µm. (I) B16-F10 cells (2×10⁵) were intravenously injected into control or Tfam-/- mice to establish experimental pulmonary metastasis models. Mice were sacrificed on day 14, then the single cell suspension of the whole lung with metastatic tumor was prepared and subjected to FCM analysis. Representative scatterplots of the p15E-specific CD8+ T cells are shown in the left panel and quantified in the right panel. Cells are gated from CD45+ CD3+ subpopulation (n=4 mice). Data are presented as mean±SEM. Statistical significance in (A–F, I) was determined by a two-sided unpaired t-test. Representative results in (A–F, I) and pictures in (G, H) from two independent experiments are shown. *p<0.05, ***p<0.001, NS, not significant. LLC, Lewis lung carcinoma. FCM, flow cytometry; DC, dendritic cell; MHC, major histocompatibility complex; TAMs, tumor-associated macrophages.

