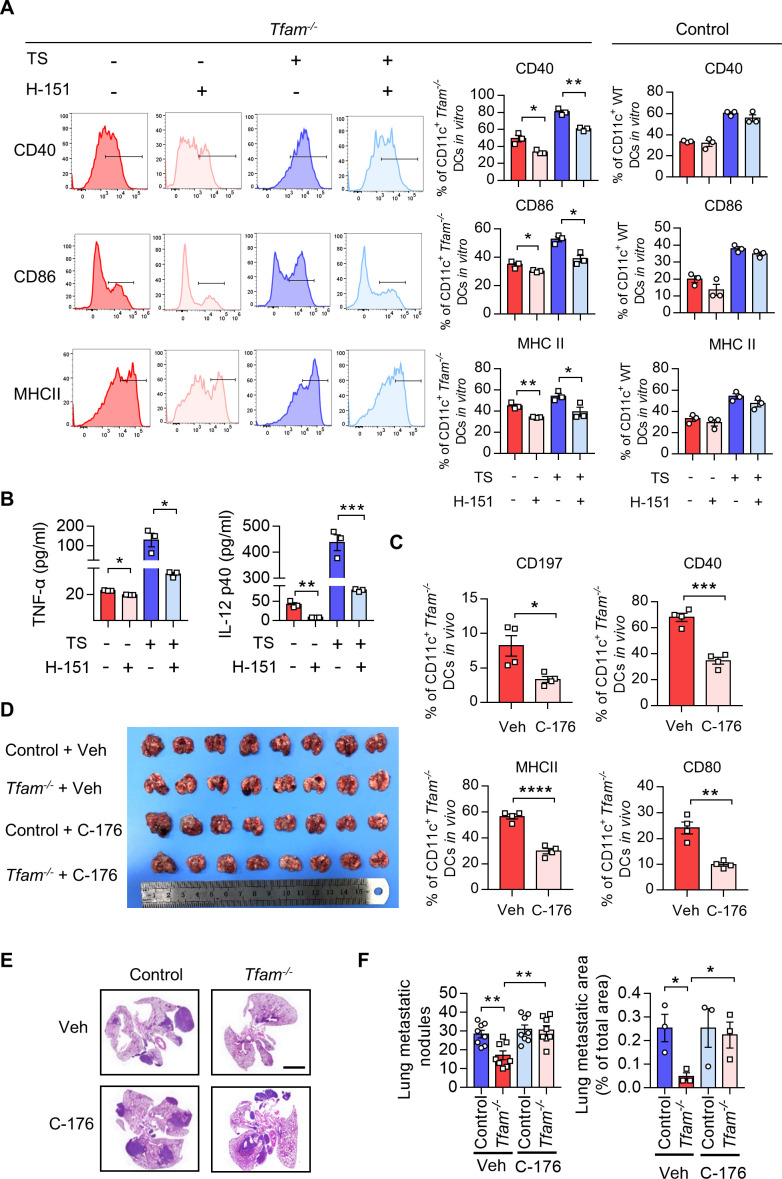
Figure 6.
STING antagonism restricts DC maturation and potentiates tumor progression in Tfam-/- mice. (A) Blockade of STING strongly repressed the maturation of DCs induced by Tfam deficiency. BMDCs from Tfam-/- mice were stimulated with or without TS or H-151 for 24 hours and then subjected to flow cytometry analysis to detect the expression of costimulatory molecules. The left panel shows the representative histograms of the gated CD11c+ Tfam-/- DCs. The quantitative data of flow cytometry results are shown in the right panel (n=3 biologically independent samples). (B) Blockade of STING noticeably reduced the secretion of inflammatory cytokines of DCs induced by Tfam deficiency. BMDCs from Tfam-/- mice were similarly treated as in (A), and then levels of TNF-α and IL-12 p40 in the supernatant were detected by ELISA (n = 3 biologically independent samples). The original levels of cytokines in TS were subtracted. (C) Blockade of STING significantly abolished the migration and maturation of Tfam-/-DCs in vivo. Single-cell suspension of lymph nodes from Tfam-/- mice treated with C-176 (13.4 mg/kg) or Veh (solvent) were subjected to flow cytometry analysis. The percentages of CD197+, MHCII+, CD40+, or CD80+ DCs are quantified from CD11c+ gated subpopulation (n=4 mice). (D–F) Blockade of STING re-accelerates tumor progression in Tfam-/- mice. LLC cells (5×10⁵) were intravenously injected into control or Tfam-/- mice to establish experimental pulmonary metastasis models (n=8 mice). Mice simultaneously received daily intraperitoneal injections of C-176 (13.4 mg/kg) or Veh (solvent) and sacrificed on day 24. The gross appearance (D) and H&E staining (E) of the lungs were also examined and the lung metastasis nodules and metastatic area (n=3 mice’s lungs were paraffin embedded) were evaluated (F). Scale bars represent 2 mm. LLC, Lewis lung carcinoma. Data represent the mean±SEM. Statistical significance was determined by a two-sided unpaired t-test in (AB, C, F). Representative results in (A, B) and picture in (A) from three independent experiments are shown. Representative results in (C–F) and pictures in (E) from two independent experiments are shown. *p<0.05, **p<0.01, ***p<0.001, ****p<0.0001. BMDCs, bone marrow-derived DCs; DC, dendritic cell; MHC, major histocompatibility complex; TS, tumor supernatant.

