. 2023 Feb 20;15(1):2177978. doi: 10.1080/19420862.2023.2177978

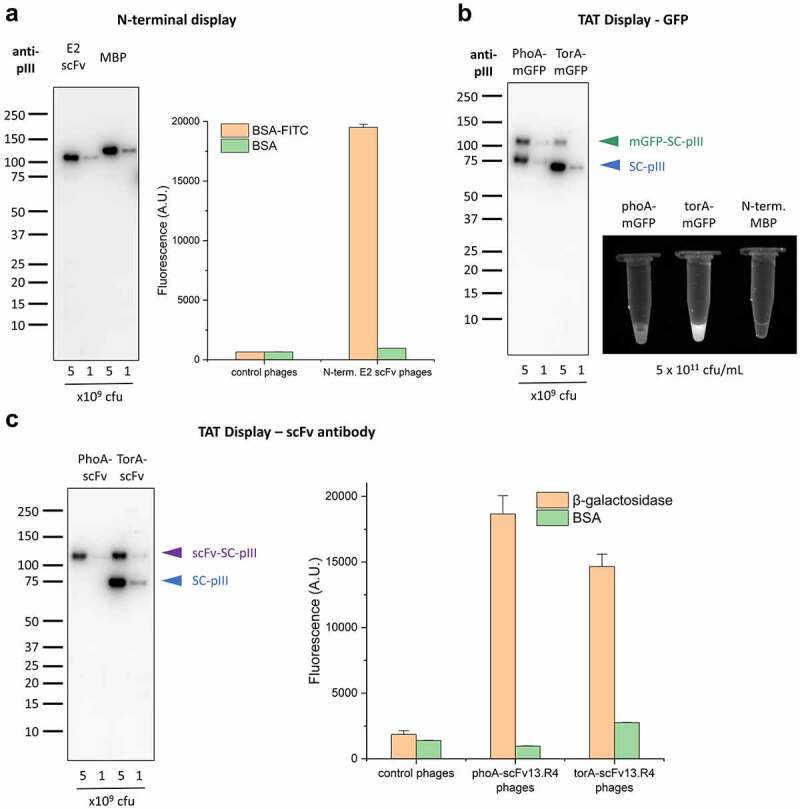
Figure 4.

N-terminal display and display mediated via the TAT pathway using SpyDisplay. A (left) shows the use of immunoblotting for detection of phages displaying the E2 scFv or MBP with an N-terminal SpyTag. The results confirm the correct assembly of phages using N-terminal display. A (right) shows an ELISA to test the binding of polyvalent SpyDisplay phages displaying the E2 scFv with an N-terminal SpyTag to control or cognate antigens. The results indicate a target specific binding of the Fab-phages and no binding to the negative control. B (left) shows the use of immunoblotting and fluorescence imaging to test the expression of mGFP-SpyTag with a PhoA or TorA leader peptide on polyvalent SpyDisplay phages. The results of the immunoblot confirm the correct assembly of mGFP-phages for both setups, with the TorA-mGFP phages showing a slightly lower display rate than the PhoA-mGFP phages. B (right) is a fluorescence image of microcentrifuge tubes with an equal volume and titer of phages which shows that TorA-mGFP phages exhibit strong fluorescence in comparison to the PhoA-mGFP phages, which are only a weakly fluorescent. C (left) shows the use of immunoblotting for detection of phages displaying scFv13.R4-SpyTag with a PhoA or TorA leader peptide to control or cognate antigens. The results confirm the correct assembly of scFv-phages for both setups, with the TorA-scFv phages showing a much lower display rate than the PhoA-scFv phages. C (right) shows an ELISA to test the binding of polyvalent SpyDisplay phages displaying scFv13.R4-SpyTag with a PhoA or TorA leader peptide to BSA control or beta-galactosidase. The results indicate a target specific binding of the Fab-phages and no or only weak background binding on the respective controls.

Versatility of display setups with SpyDisplay.

(a) Left: Immunoblot analysis of polyvalent SpyDisplay phages displaying the E2 scFv or MBP with an N-terminal SpyTag. Detection was performed with anti-M13-pIII followed by sheep anti-mouse IgG (H/L):HRP. Right: ELISA of polyvalent phages displaying N-terminally SpyTagged E2 scFv on control (BSA) or cognate antigen (BSA-FITC), in comparison to control phages (displaying N-terminally SpyTagged MBP). (b) Left: Immunoblot analysis of polyvalent SpyDisplay phages displaying mGFP-SpyTag with a PhoA or TorA leader peptide. Detection performed with anti-M13-pIII followed by sheep anti-mouse IgG (H/L):HRP. Right: Fluorescence image of GFP-phages and control phages at equal concentrations (5 × 10¹¹ cfu/mL) in microcentrifuge tubes. (c) Left: Immunoblot analysis of polyvalent SpyDisplay phages displaying scFv13.R4-SpyTag with a PhoA or TorA leader peptide. Detection performed with anti-M13-pIII followed by sheep anti-mouse IgG (H/L):HRP. Right: ELISA of polyvalent phages displaying scFv13.R4 with on control (BSA) or cognate antigen (b-galactosidase), in comparison to control phages.