
Figure 8.
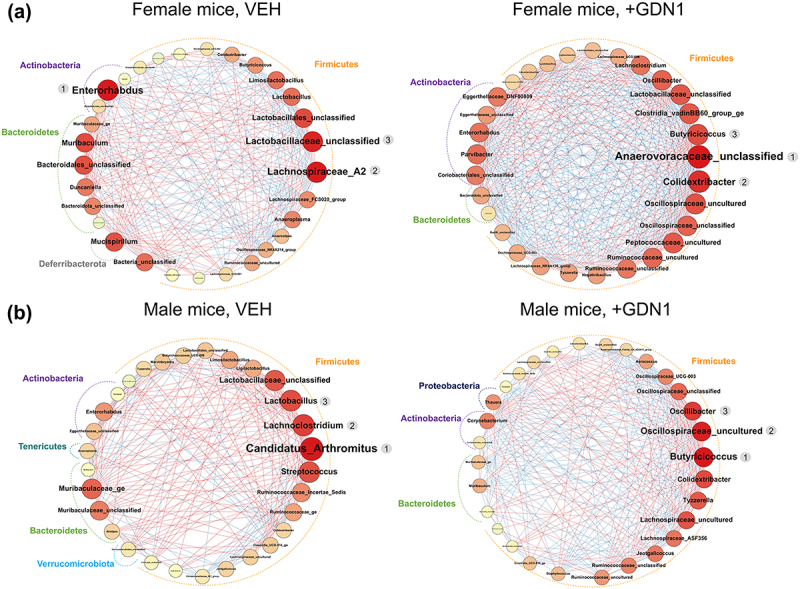
The microbial interaction networks identified in the female (A) and male (B) mice. potential microbial interactions were predicted using SparCC. nodes represent microbial genera, and only high-scoring eigenvector centrality nodes (top 30) are shown. eigenvector centrality is indicated by node size and color; a larger round node with a darker red hue corresponds to a higher value of eigenvector centrality. conversely, a smaller round node with a bright yellow hue corresponds to a lower value of eigenvector centrality. A node with the highest eigenvector centrality (rank 1, which is highly interacting with other nodes) may play a pivotal role in the network. A red edge depicts a positive interaction, whereas a blue edge depicts a negative interaction.