
Figure 4.
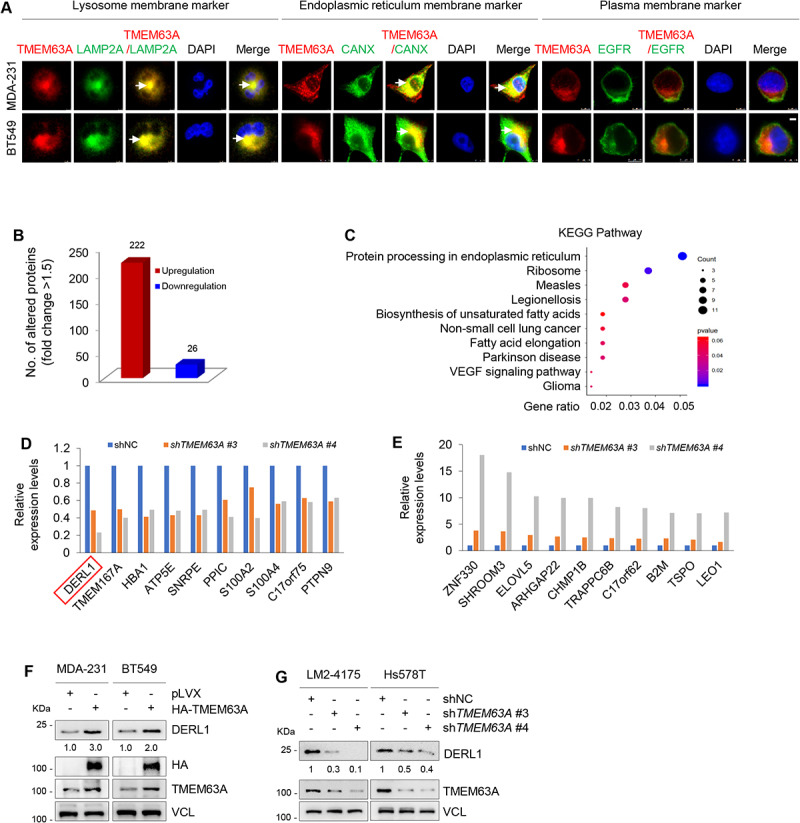
TMEM63A regulates oncoprotein DERL1 at the protein level. (A) MDA-231 and BT549 cells stably expressing pLVX and Flag-TMEM63A were subjected to immunofluorescent staining with antibodies against Flag (red), LAMP2A (green, left), CANX (green, middle), and EGFR (green, right). DNA was counterstained with DAPI (blue). Typical colocalization between Flag-TMEM63A and LAMP2A or CANX (yellow) is indicated by white arrows (scale bar:7.5 μm). (B) The number of differentially expressed proteins between cells expressing shTMEM63A (#3 and #4) and shNC based on the cutoff value of 1.5-fold change. (C) KEGG pathway analysis of differentially expressed proteins between cells expressing shTMEM63A (#3 and #4) and shNC. (D-E) The top 10 downregulated proteins (D) and 10 upregulated proteins (E) after knockdown of TMEM63A in LM2-4175 cells. (F) MDA-231 and BT549 cells stably expressing pLVX and HA-TMEM63A were subjected to immunoblotting analysis with the indicated antibodies. (G) LM2-4175 and Hs578T stably expressing shNC and shTMEM63A (#3 and #4) were subjected to immunoblotting analysis with the indicated antibodies. In panels F and G, densitometric quantitation of western blots was performed using ImageJ.