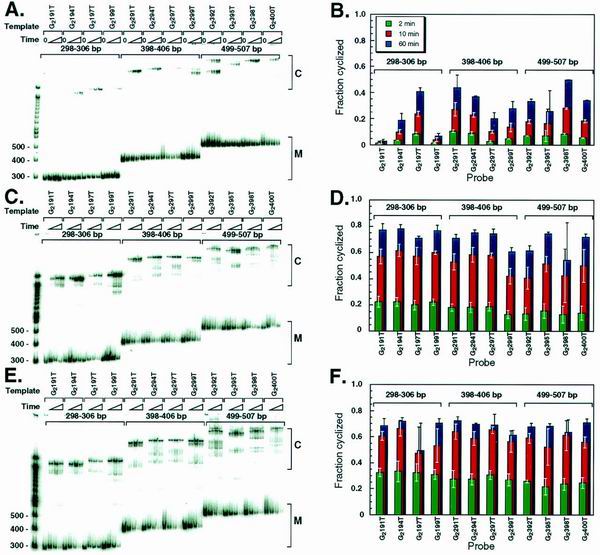
FIG. 4.
Cyclization with longer DNA probes. (A) Electrophoretic analysis of the DNA probes shown in Fig. 2B after ligation for 0, 2, 10, and 60 min in the absence of NE. (B) Quantitation of panel A. Error bars represent standard deviations after 2 to 5 repeats. (C) Electrophoretic analysis of the DNA probes shown in Fig. 2B after ligation for 0, 2, 10, and 60 min in the presence of 0.1 mg of heat-treated NE/ml. (D) Quantitation of panel C. (E) Electrophoretic analysis of the DNA probes in shown Fig. 2B after ligation for 0, 2, 10, and 60 min in the presence of 3 μg of heat-treated rHMG-2/ml. (F) Quantitation of panel E.

