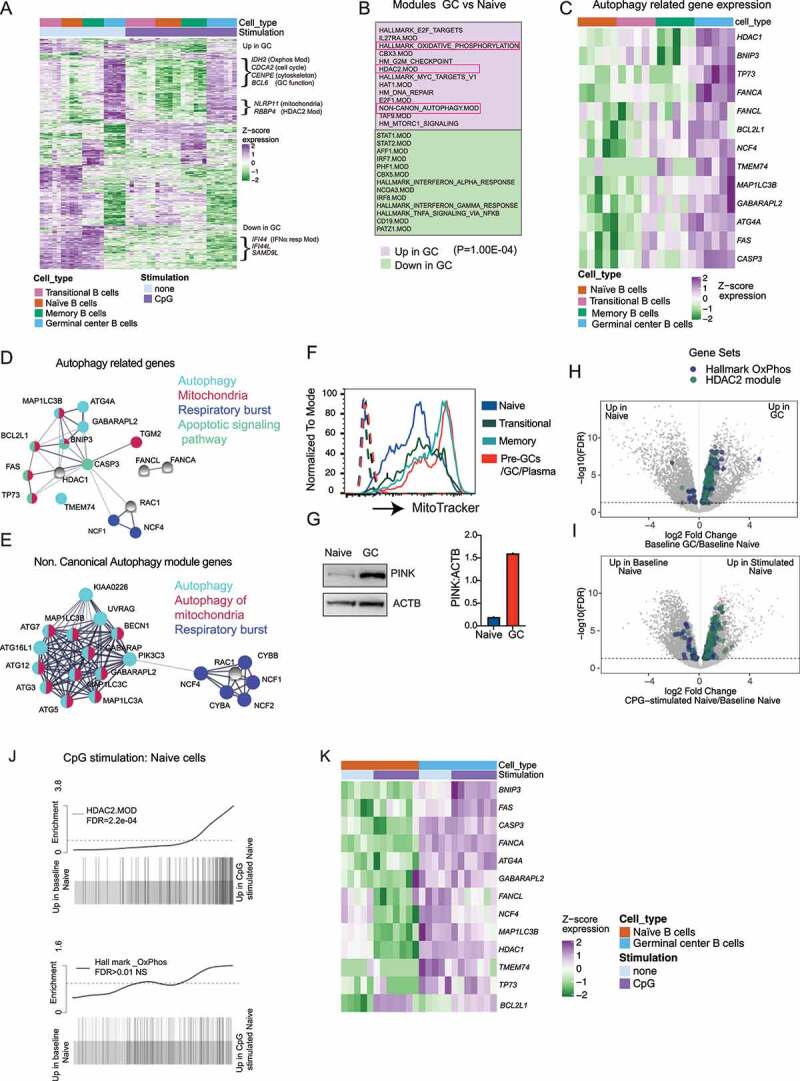
Figure 3.

Expression and activation of autophagy pathway in activated B cells are related to the upregulation of mitochondrial proteins. Sorted B cell subsets (as in Fig 1A) with or without stimulation (3 h) with CpG DNA were used for RNA-Seq. Cells were stimulated with either CpG 2395 or CpG 2006, and data include results from both stimulations. (A) Gene expression heat map generated using the 350 most significantly DE genes from each subset compared to other subsets. Genes were hierarchically clustered using Euclidean distance and complete linkage; colors represent scaled gene expression values. Genes upregulated or downregulated in GC cells are highlighted. (B) Modules upregulated or downregulated in GC cells compared to naïve cells, based on mroast analysis. 13 modules from each subset are shown, and P-value from mroast analysis is indicated. (C) Heat map of selected autophagy genes’ scaled expression in the different B cell subsets. (D) String network analysis for protein–protein interactions (PPI) among autophagy-related genes that are enriched in GC cells. Proteins are presented as circular nodes and known interactions from STRING are shown as gray lines. Thickness of the line indicates strength of data support. (E) String network analysis of the genes from the Non.Canonical Autophagy module for PPI interactions. (F) Flow cytometry analysis of mitochondrial mass in the tonsil subsets using MitoTracker dye. Histogram overlays show each tonsil B cell subset, and dotted histograms show each B cell subset without the MitoTracker dye stain. (G) Western blots for mitophagy-related protein PINK in sorted naïve and GC B cell subset from one donor. Quantification is presented for PINK based on the amount of ACTB. (H-I) Volcano plots showing differentially expressed genes in naive cells compared to GC cells or naïve cells with and without CpG stimulation. The genes belonging to Oxidative phosphorylation and HDAC2 modules from gene set enrichment analysis are highlighted. (J) Barcode plots showing enrichment of HDAC2 or Hallmark Oxphos module genes in naïve cells upon CpG stimulation. FDR (false discovery rate) is indicated in the plot. (K) Heat map of selected autophagy genes’ scaled expression in GC and naïve B cell subsets with or without CpG stimulation. Gene expression data are based on RNA-Seq from five different donor tonsil samples.
