Figure 1.

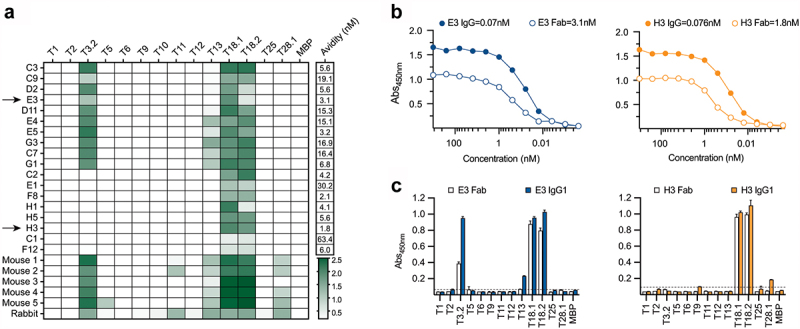
T-antigen specificity of Fab and animal sera. (a) Reactivity of the eighteen Fab and murine and rabbit sera to the T-antigen panel. Sera was diluted at 1: 200 and Fab were diluted to 100 nM, screened by ELISA and absorbances (450 nm) are shown in a colour gradient from white to green. Avidity of the Fab for T18.1 was estimated as the concentration for half-maximum binding (EC50) by ELISA, calculated using an asymmetric sigmoidal, five-parameter logistic equation and shown as an additional column to the right of the heatmap. (b) Comparison of IgG1 and Fab binding to T18.1 by ELISA. The solid lines represent the IgG1 clones while the dotted lines represent the Fab. Estimated avidity of the IgG1 and Fab to T18.1 are indicated. (c) Specificity of IgG1 (solid bars) and Fab (open bars) to the T-antigen panel as measured by ELISA. Dotted line indicates the cut-off (mean+3SD of negative control). Bars represents the mean and standard deviation.
