Figure 1.

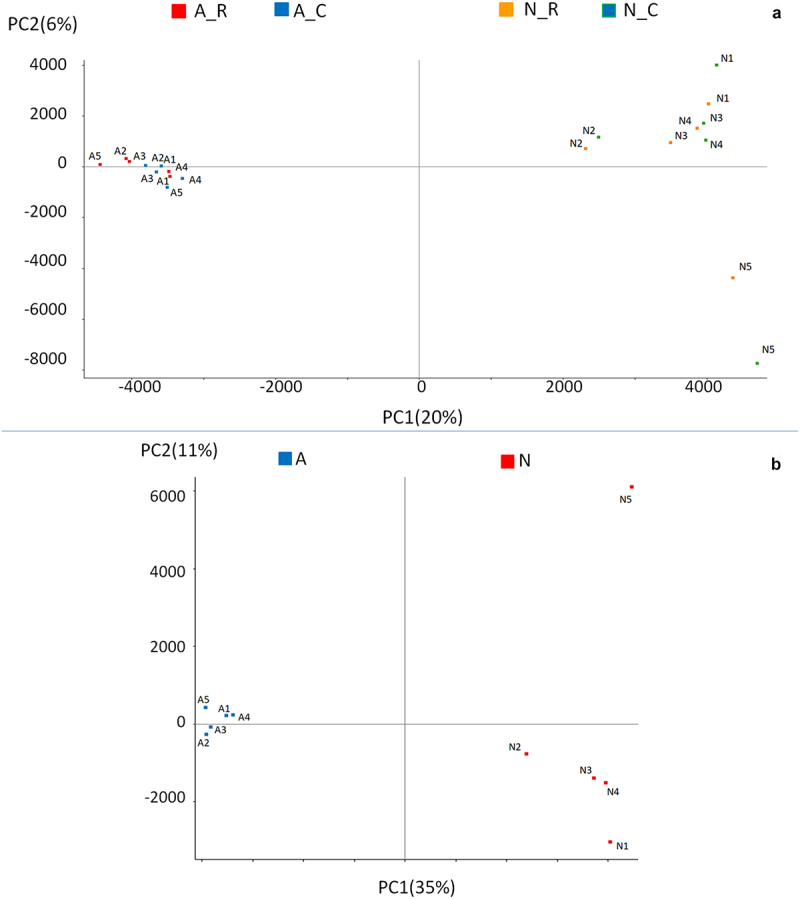
Principal Component Analysis of total CpGs in Angus and Nellore animals considering: a) individuals in the two seasons (20 samples) and b) individuals grouped across the hot (C = Challenge) and cool seasons (R = Recovery) (10 samples).

Principal Component Analysis of total CpGs in Angus and Nellore animals considering: a) individuals in the two seasons (20 samples) and b) individuals grouped across the hot (C = Challenge) and cool seasons (R = Recovery) (10 samples).