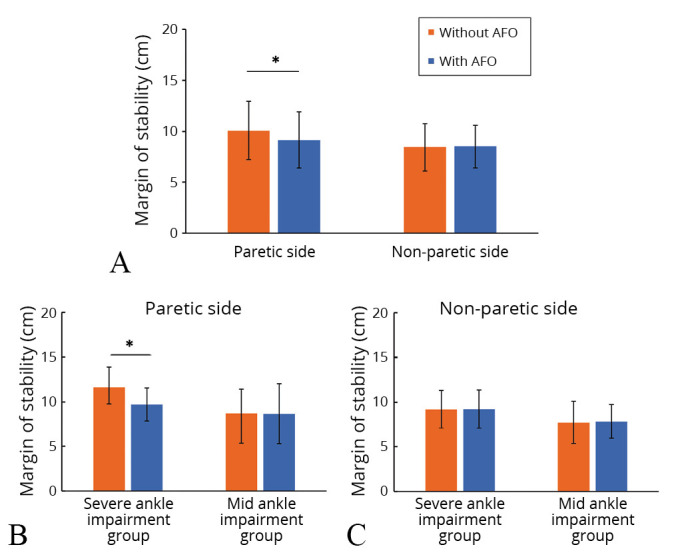
Figure 3.

—A) Margin of stability (MoS) with or without using an ankle-foot orthosis (AFO) in paretic and non-paretic sides in total study population; B) and subgroup comparisons in the severe ankle impairment group and mild ankle impairment group in paretic side; and C) and non-paretic side. The bars indicate the average values of MoS at paretic/non-paretic heel strikes with and without an AFO in each group. The MoS on the paretic side was significantly smaller than that without an AFO in the overall comparison (A) and in the severe impairment group (B). No significant difference was observed in the mild impairment group (C). Error bar indicates the standard deviation. *P< 0.01.
