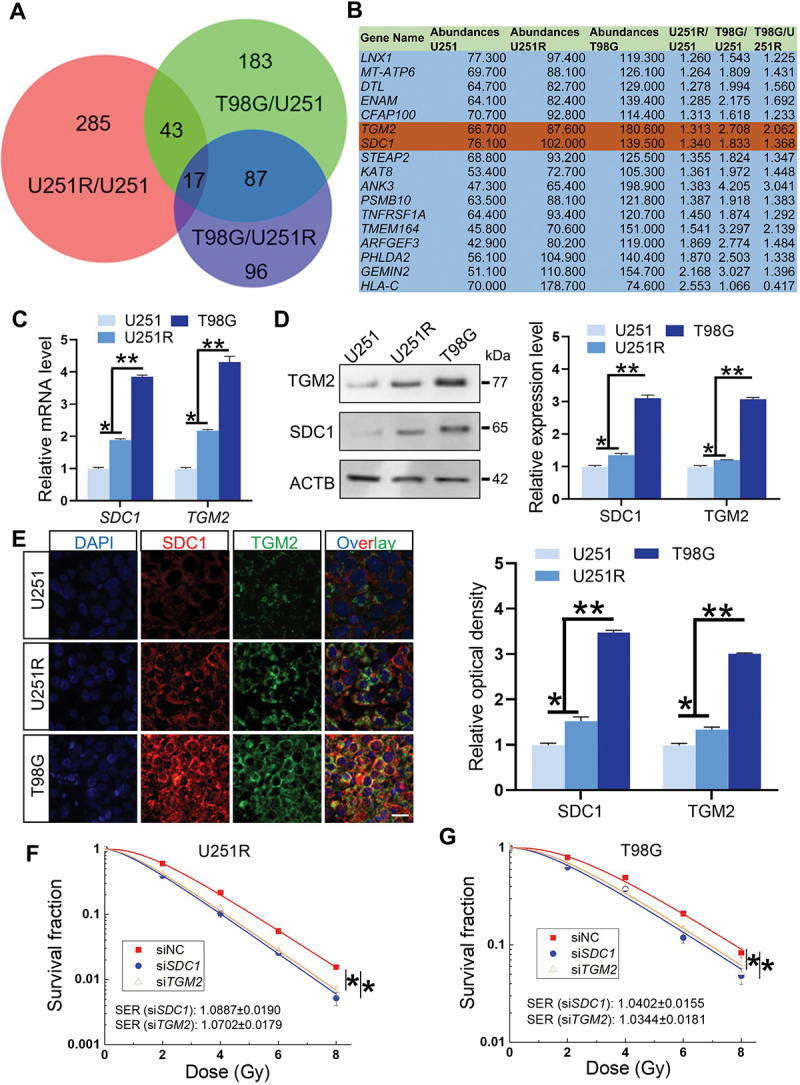
Figure 2.

SDC1 and TGM2 enhanced radioresistance of GBM cells. (A) Wayne chart of the overexpressed genes in U251R and T98G cells in comparison with U251 or U251R cells. The interaction contains 17 genes. (B) List of above 17 upregulated genes. (C) Real-time PCR analysis of SDC1 and TGM2 mRNA levels in U251, U251R and T98G cells. (D) Western blot analysis (left) and quantification (right) of SDC1 and TGM2 protein expression levels in U251, U251R and T98G cells. (E) Immunofluorescence staining (left) of SDC1 and TGM2 and their relative densities (right) in xenografts of U251, U251R and T98G cells. Scale bars: 20 μm. (F-G) Dose responses of the survival fractions of U251R (F) and T98G (G) cells transfected with siNC (negative control), siSDC1 and siTGM2, respectively. *P < 0.05 and **P < 0.01.
