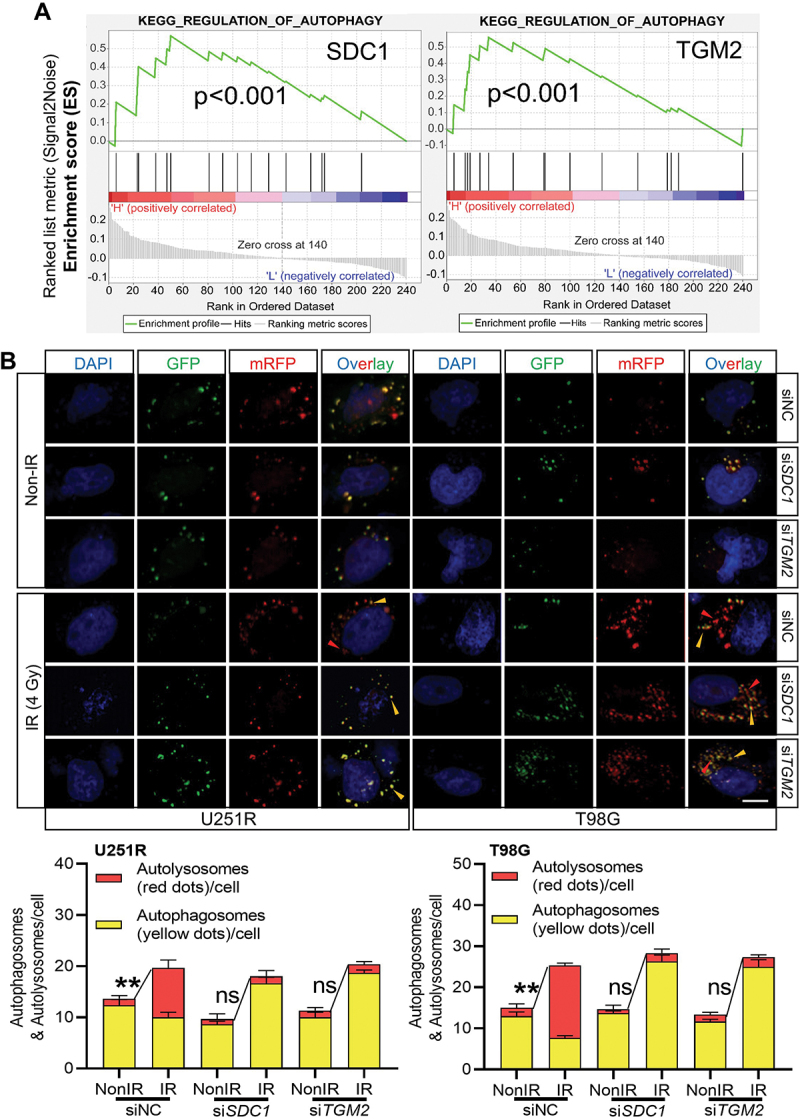
Figure 3.

Inhibition of SDC1 and TGM2 suppressed autolysosome formation. (A) KEGG pathway enrichment analysis of SDC1 (left) and TGM2 (right). (B) Representative image of the mRFP‐GFP‐LC3 fusion protein expressions in U251R and T98 G cells under different siRNAs transfection at 6 h after 4 Gy IR. Red dots indicate autolysosomes while yellow dots indicate autophagosomes in overlays. Nuclei were stained with DAPI. Scale bars: 10 μm. The average number of autophagosomes and autolysosomes in each indicated cell was quantified. ns P ≥ 0.05 and **P < 0.01.
