Figure 1.

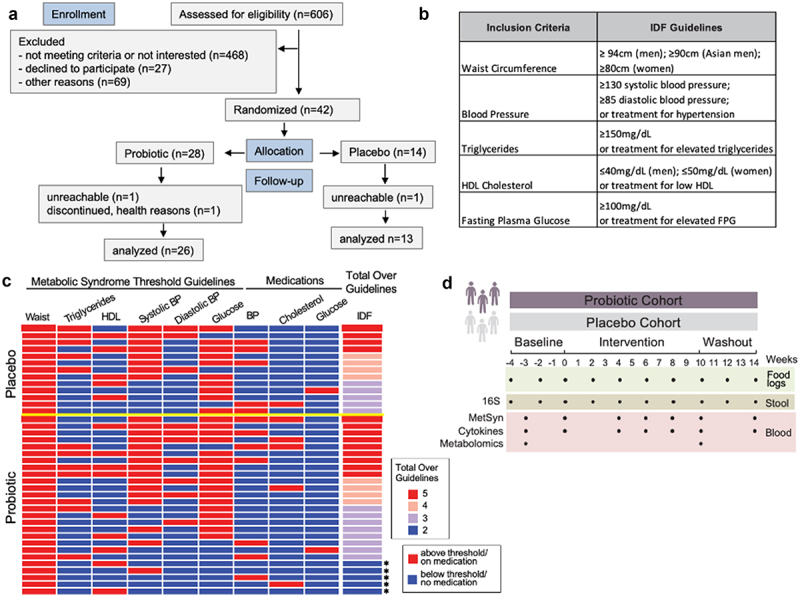
Study overview. (a) CONSORT flow diagram for enrollment, allocation, follow-up, and analysis. (b) Metabolic syndrome guidelines as defined by the International Diabetes Foundation (IDF). (c) Heat map depicting the study inclusion criteria met by participants (rows) along with medication use. Those that only satisfied 2 criteria are indicated by an asterisk. Yellow line separates placebo from probiotic arm. HDL = high density lipoprotein; BP = blood pressure (d) Stool and blood samples along with participant food logs were collected over an 18-week period for microbiome and immune system measurements.
