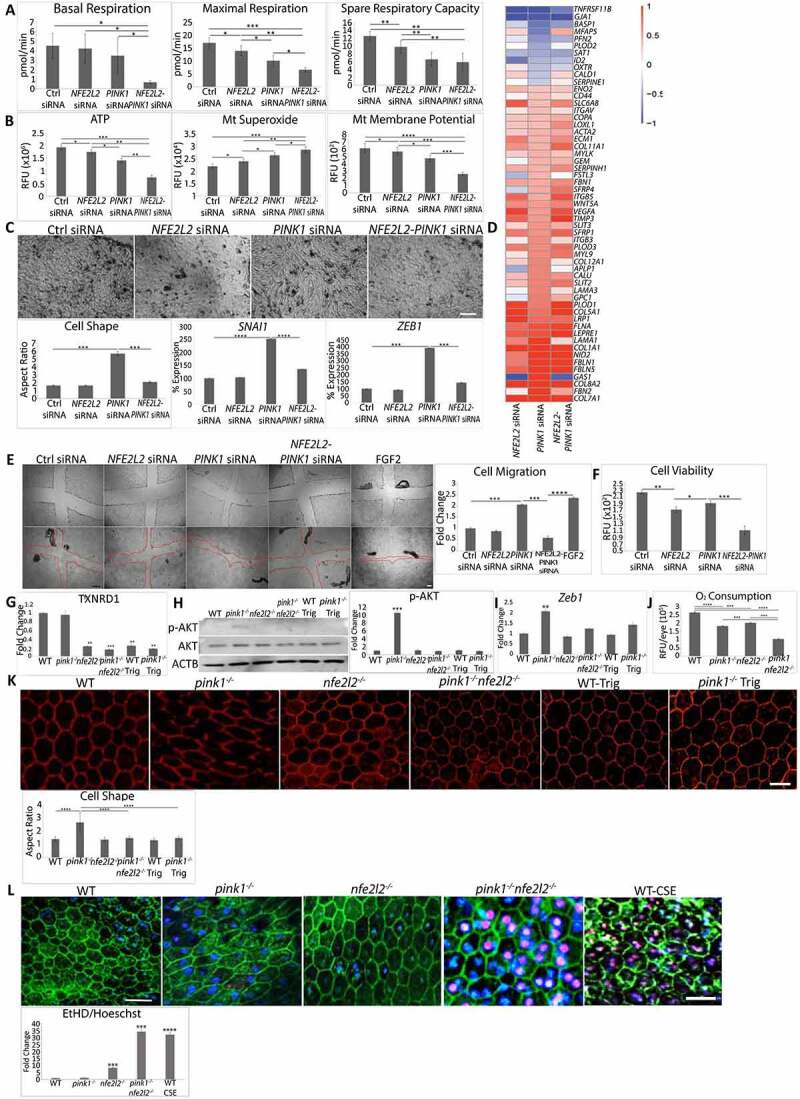
Figure 6.

Two impaired cytoprotective pathways induce cell death. ARPE-19 cells were treated with Ctrl, PINK1, NFE2L2, and PINK1-NFE2L2 siRNAs. (a) Basal, maximal, spare respiratory capacity oxygen consumption were measured by Seahorse assay and (b) ATP by CellTiter-Glo® Luminescent Assay, mitochondrial superoxide anion by MitoSOX assay, and mitochondrial membrane potential by TMRM assay were quantified. (c) 10X brightfield image showing ARPE-19 cell morphology after treatment with siRNAs for Ctrl, NFE2L2, PINK1, and NFE2L2-PINK1. Cell morphology was plotted after calculating the cell aspect ratio (>20 cells measured/group). ZEB1 and SNAI1 were quantified using TaqMan qRT-PCR and plotted as fold change after ddCT calculations (N = 3). (d) RNA-seq analysis showing EMT-specific genes from the Broad Institute’s GSEA data set with transcriptional reprogramming induced by PINK1-KD is modified by PINK1-NFE2L2-KD. (e) Cells were wounded with a plastic tip (top panels), migration was measured 24 h later, and graphed. (f) Cell viability quantified using the LIVE/DEAD assay. WT, pink1−/−, nfe2l2−/−, pink1−/−nfe2l2−/-, and pink1−/− mice treated with Trig mice were assessed for retrograde mitochondrial to nuclear signaling. (g) Txnrd1 was assessed using TaqMan RT-qPCR and plotted as fold change after ddCT calculations (N = 3). (h) Western blot of p-AKT and AKT and quantified as fold change (N = 3). ACTB was used as loading control. (i) Zeb1 was assessed using TaqMan RT-qPCR and plotted as fold change after ddCT calculations (N = 3). (j) In vivo oxygen consumption measured using Mito-ID oxygen consumption kit and plotted as fluorescence units per eye (N = 3). (k) RPE flatmounts stained with anti-TJ1 and imaged at 20X. Cell shape change was quantified using the cell aspect ratio with ImageJ (>15 cells measured/group, N = 5). (l) RPE cell survival from freshly dissected eyecups was assessed using ethidium homodimer staining with TJ1 immunolabeling to identify cell margins. The number of ethidium-stained nuclei was quantified and presented in the graph. A toxic dose of CSE (1000 μg/ml) was used. Bar: 25 μm. Mean ± SD, Student’s t-test; *P < 0.05, **P < 0.01, ***P < 0.001, ****P < 0.0001.
