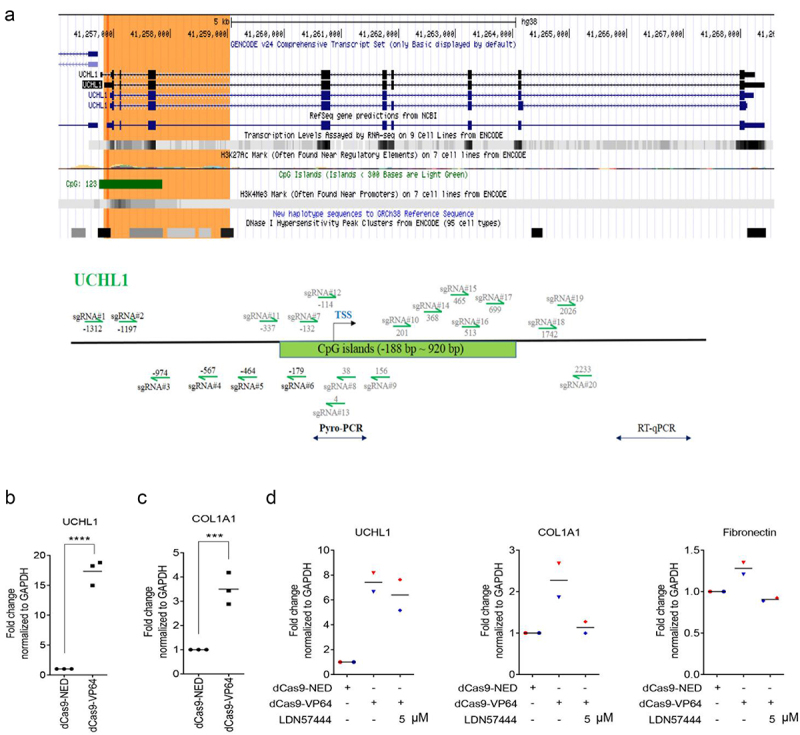
Figure 6.

COL1A1 is increased as a response to targeted endogenous upregulation of UCHL1. (a) Schematic structure of the UCHL1 promoter. The green highlighted part shows the CpG island and the sgRNAs designed around the TSS are indicated as arrows. (b, c) Targeting dCas9-VP64 induced upregulation of UCHL1 and further increased the expression of COL1A1. BEAS-2B cells were seeded and transiently co-transfected with 1 µg a mixture of UCHL1 sgRNA (#4/5/6) together with 1 µg dCas9-NED-mCherry, and 1 µg dCas9-NED or dCas9-VP64 through PEI (n = 3). (d) The transfection is same as (b), 24 h post transfection, cells were treated without or with 5 µM LDN57444 for 24 h (n = 2). The control group was treated with equal volume of DMSO. mCherry-positive cells were collected and sorted by FACS at 48 h post treatment. Total RNA was isolated and real-time qRT-PCR was performed to measure gene expression. Statistical significance was determined using two-tailed unpaired t-test, *p < 0.05, **p < 0.01, ***p < 0.001, ****p < 0.0001.
