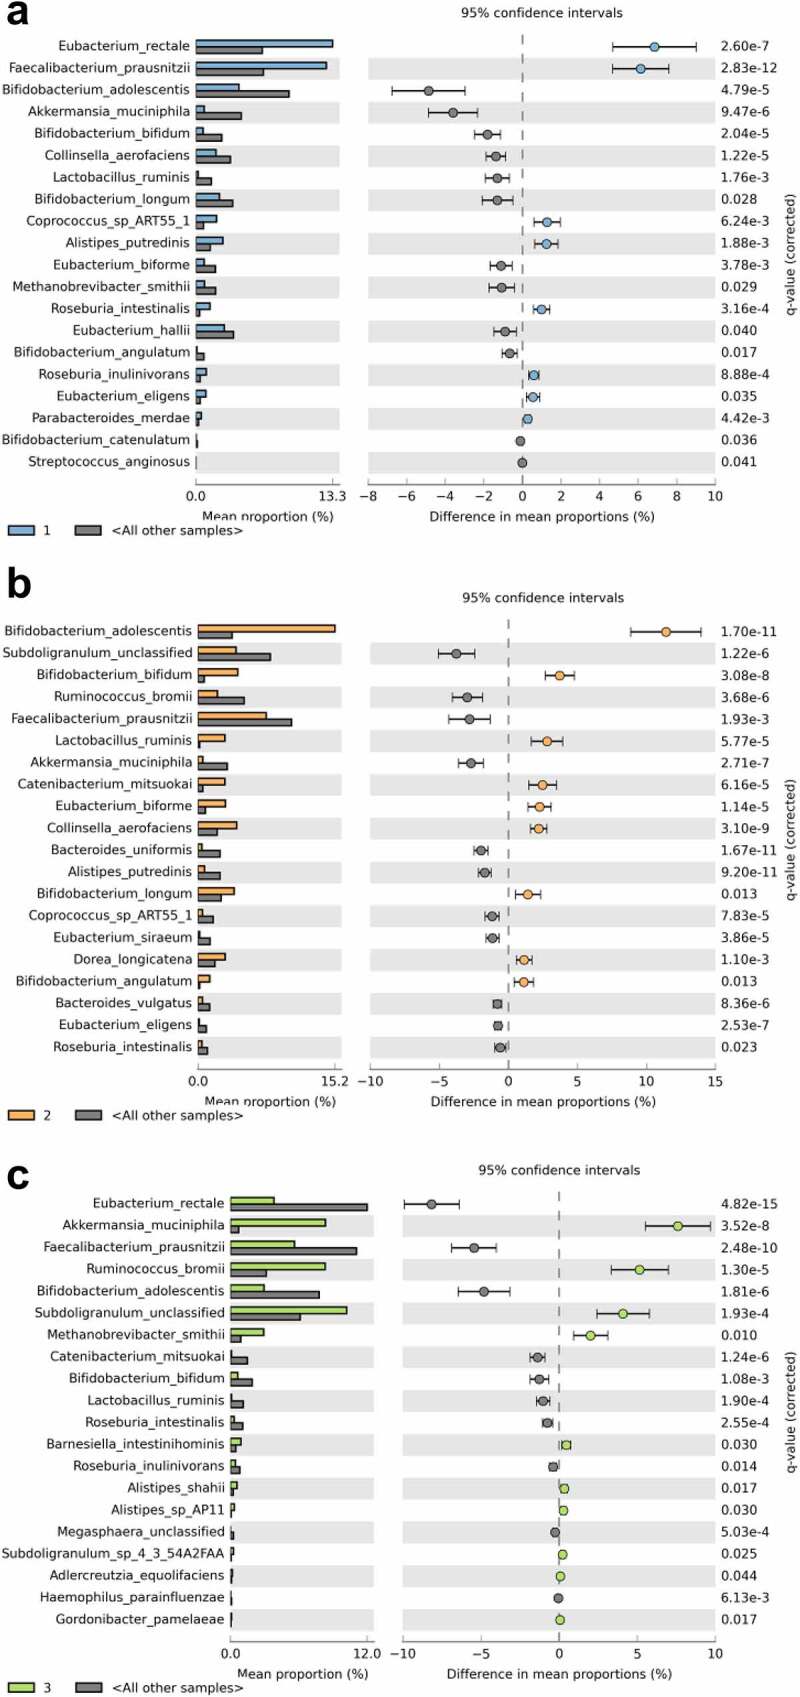
Figure 4.

Description of predicted enterotypes. Each panel (a-c) contains the STAMP output (extended error bar plot) depicting species-level features within each enterotype with significant differential abundance (Welch’s t test with Benjamini-Hochberg false discovery rate), compared to all other enterotypes.
