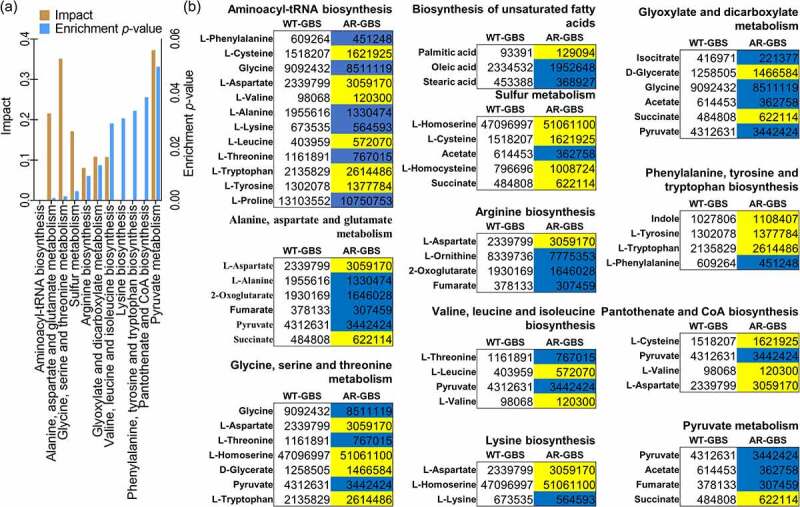
Figure 2.

Biomarkers and pathways differentiating WT-GBS and AR-GBS. (a) Pathway enrichment analysis. (b) the volume of the differential metabolites of AR-GBS compared with WT-GBS. The colour of blue indicates metabolites of decreased abundance; yellow indicates metabolites of increased abundance.
