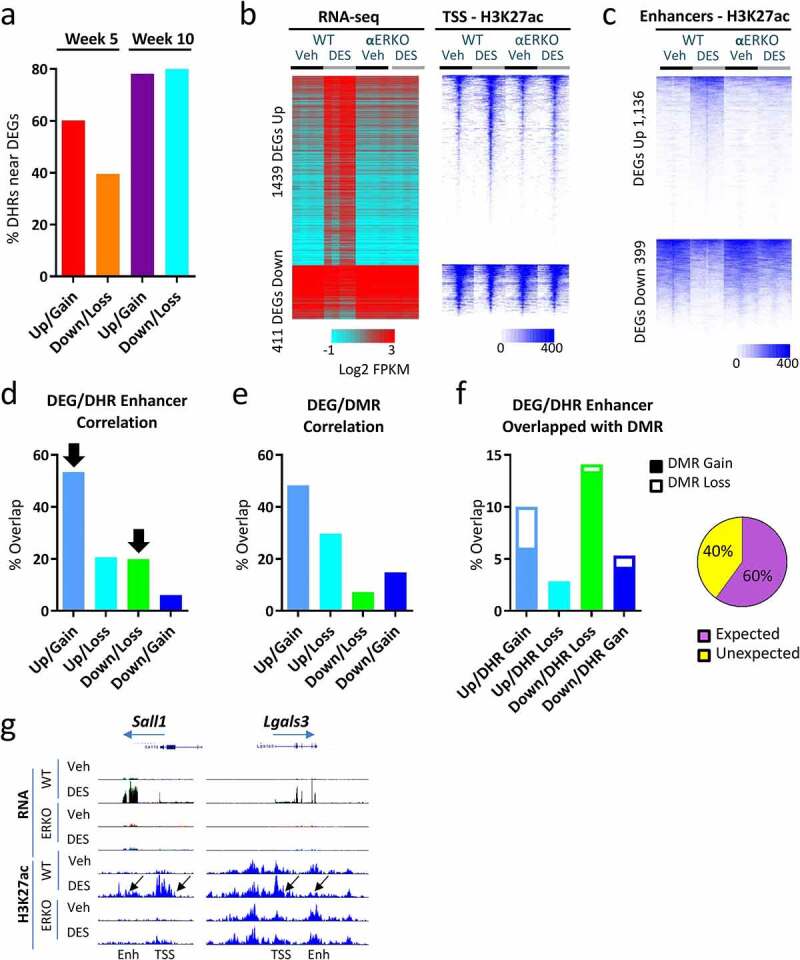
Figure 4.

Correlation between DEGs, DHRs and DMRs in SV following neonatal DES exposure. (a) Percent of up- and down-regulated genes (WT-DES versus WT-veh) at week 5 and week 10 that have a DHR gain or loss ±100 Kb of the TSS. (b) Heat map displaying 1,850 persistently altered DEGs (WT-DES versus WT-veh, overlapping week 5 and week 10). RNA-seq (log2 FPKM) and H3K27ac ChIP-seq signal mapping to a ± 5 kb window around TSS in WT and αERKO SVs. Heat maps are split into up- and down-regulated genes. Heat maps are organized by high to low expression in the WT-DES RNA-seq sample and H3K27ac signal is plotted in the same gene order. (c) DHRs ±100 Kb of the TSS of up- or down-regulated genes are plotted. Heat map is organized by high to low signal in the WT-DES sample. (d) Percent overlap of DHR (gain or loss) and DEG (up or down) is plotted. Black arrows indicated the expected correlation of DHR and DEG direction. (e) Percent overlap of DMR (gain or loss) and DEG (up or down) is plotted. (f) Overlap of DEG/DHR categories from Figure 4d with DMRs are plotted in a stacked bar chart with open part of the bar as percentage of DMR gain and solid part of the bar as DMR loss. Pie chart indicated the proportion of expected and unexpected DMR direction. (g) Examples of the RNA-seq and H3K27ac at the TSS and enhancers of persistently altered genes.
