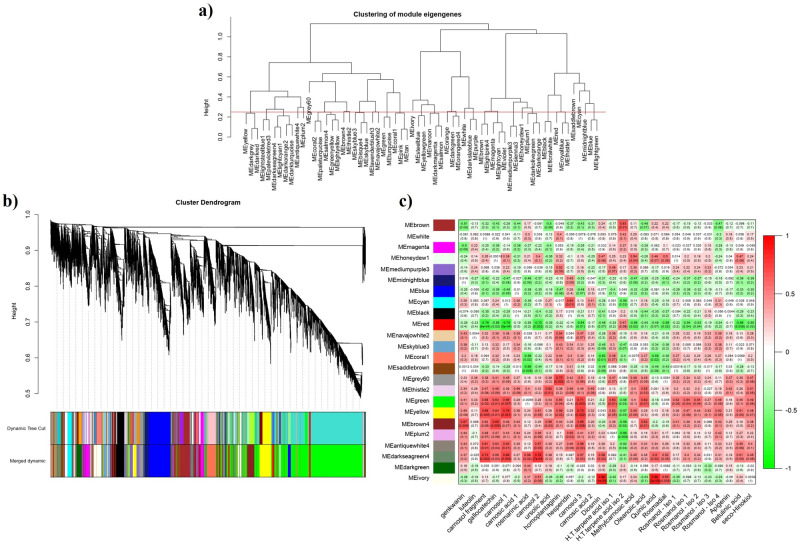
Fig 2. The gene network analysis of the biosynthesis pathway of secondary metabolites in R. officinalis.
a) Clustering dendrogram of the modules, whereas the horizontal line showing merge cut height of 0.25. b) Co-expression modules constructed. Dendrograms produced by average linkage of hierarchical clustering of genes, which is based on a topological overlap matrix (TOM). The modules were assigned colors as indicated in the horizontal bar beneath the dendrogram. c) Heat map of correlation between eigengene modules and secondary metabolites. Each row shows a module eigengene, each column shows a secondary metabolite. Each cell contains the corresponding correlation and P-value. The correlation between modules and secondary metabolites in the cells has a ratio ranged from -1 to +1. The more this ratio closer to +1, the color changes from green to red.

