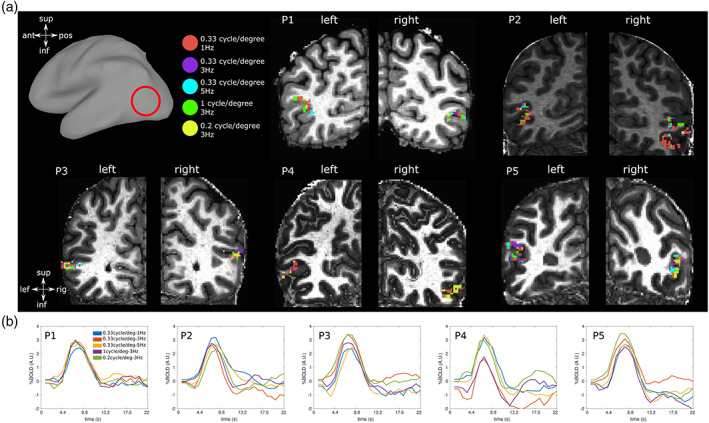
FIGURE 2.

(a) Spatiotemporal frequency preference within hMT+ ROI of each participant plotted on each anatomical space. The amplitude with the highest value across all spatiotemporal frequency conditions determined the preferred spatiotemporal frequency combination of each voxel. (b) Mean HRF across each bilateral ROI in response to each spatiotemporal combination of the visual stimuli for each participant. Mean r 2 across conditions were significant at p = .05 and equal to 0.12, 0.12 0.14, 0.10 and 0.14 for each participant respectively
