
FIGURE 3.
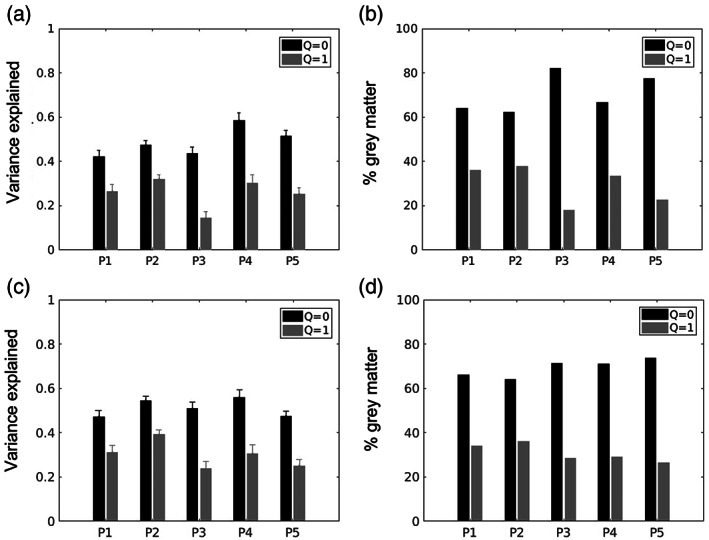
(a) Single participant variance explained in split‐run cross validation (fitted on first half of the run and validated on second half) by Gaussian tuning models with independent spatial and temporal frequency tuning (Q = 0) and tuning for speed (Q = 1). Each bar represents the mean variance explained and standard error for bilateral hMT+ ROI voxels of each participant (P1–P5, x‐axis). (b) Single participant percentage of voxels within hMT+ ROIs exhibiting separable spatiotemporal frequency tuning (Q = 0, black bars) or speed tuning, that is same temporal frequency preference for the different spatial frequency of the moving dartboard (Q = 1, grey bars), (c,d) same as a and b tested in split‐run cross validation on second half and validated on first half