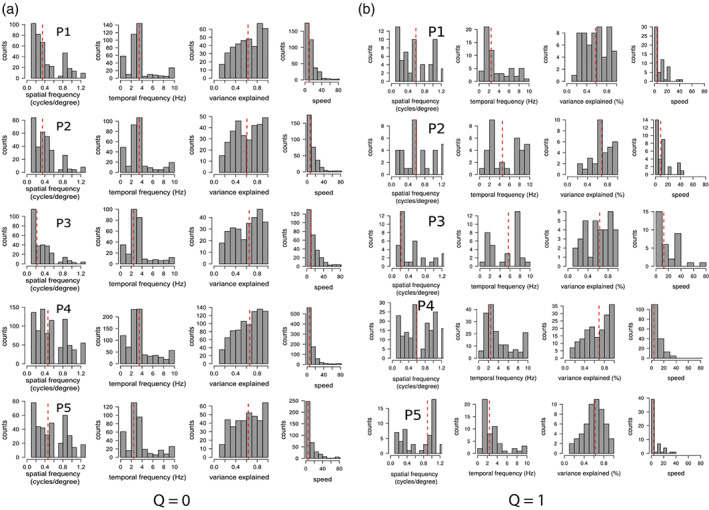
FIGURE 4.

Histograms of estimated optimal temporal frequencies, spatial frequencies, variance explained, and speeds obtained in cross validation for each participant's bilateral hMT+ ROI for the model Q = 0 (a) and for the speed tuning model Q = 1 (b). Red dashed line shows the median values across voxels. Red dashed line shows the median values across voxels. Voxels with variance explained below 0.1 were discarded for each model separately
