
FIGURE 5.
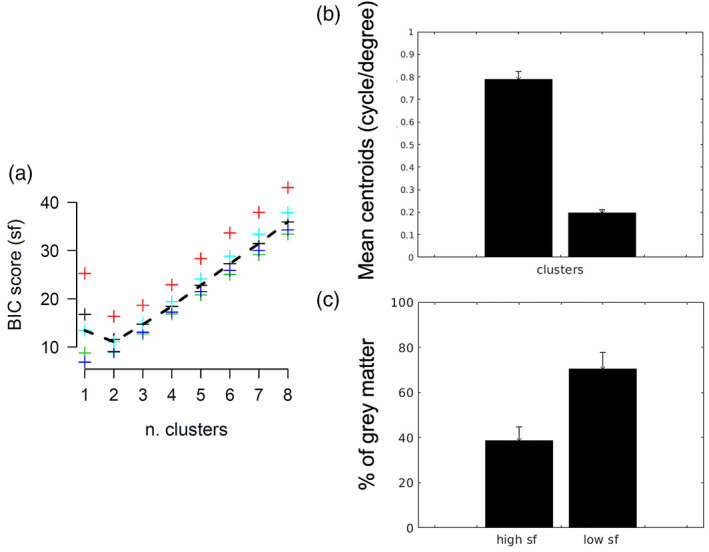
(a) Bayesian information criterion score as a function of the number k of clusters for the optimal spatial frequency values. Each color represents a single participant. Dashed line represents the mean score across participants. K = 2 was selected for the optimal number of clusters (b) mean centroids value and standard deviation across participants hMT+ ROIs for each spatial frequency cluster (c) mean percentage of grey matter and standard deviation across participants hMT+ ROIs for each spatial frequency cluster