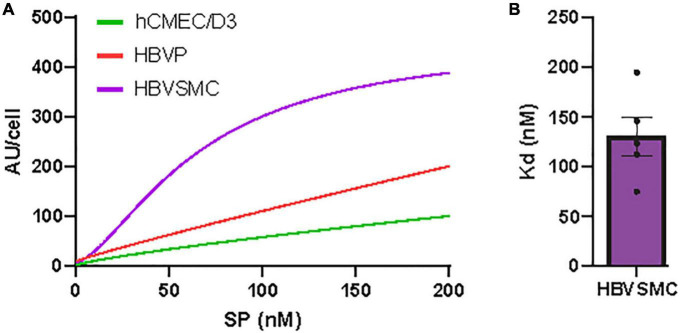
FIGURE 2.
Concentration-dependent SARS-CoV-2/SP uptake by cerebrovascular cells. (A) SP-555 uptake at different SP-555 concentration for the hCMEC/D3 (green), HBVP (red), and HBVSMC (purple) using curve fitting. (B) Binding constant (Kd) for HBVSMC that was best fitted to a saturable uptake. There was no saturation for the other cell types over the concentrations used. Values are mean ± SEM. N = 3–5 wells/group Au = Fluorescence arbitrary unit. Supplementary Figures 1, 2.

