FIGURE 3.
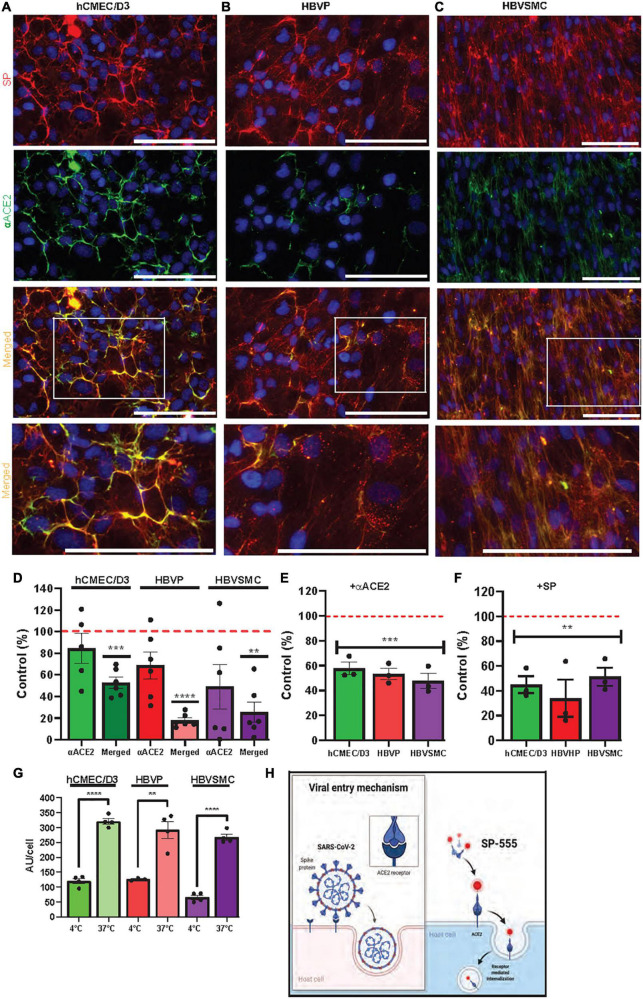
ACE2 mediates SARS-CoV-2/SP uptake in cerebrovascular cells. (A–C) SP-555 and anti-human ACE2 antibody (αACE2-488) co-localized on each of the cell types, hCMEC/D3 (A), HBVP (B), and HBVSMC (C). Lowest row is the magnified image of the white boxed area above. (D) Intensities of αACE2 and merged SP/αACE2 (yellow) were expressed as a percentage of SP-555 AU (controls were the intensities of SP-555 cellular binding (all values were corrected as per cell). (E) Excess unlabeled αACE2 displaced SP-555 binding, which confirms the data in panel (D). (F) Excess unlabeled SP (self-competition) displaced SP-555 uptake. Controls were the intensities of SP-555 cellular binding without excess unlabeled αACE2 (panel E) or unlabeled SP (panel F). (G) SP-555 receptor binding (4°C) considerable less than that at 37°C. (H) Schematic diagram showing that SP-555 mimics SARS-CoV-2 binding to ACE2. Adapted from “Proposed Therapeutic Treatments for COVID-19 Targeting Viral Entry Mechanism by www.biorender.com (2021). Retrieved from https://app.biorender.com/biorender-templates. Red dashed line is the control levels (100%). Values are mean ± SEM. N = number of well use (each data point). Statistically analyzed was by analysis of variance (ANOVA) followed by Tukey post-hoc test. *P < 0.05, **P < 0.01, and ***P < 0.001 and ****P < 0.0001. GraphPad Prism version 9.2.0 was used. Scale bar = 100 μm. Supplementary Figures 1, 3.

