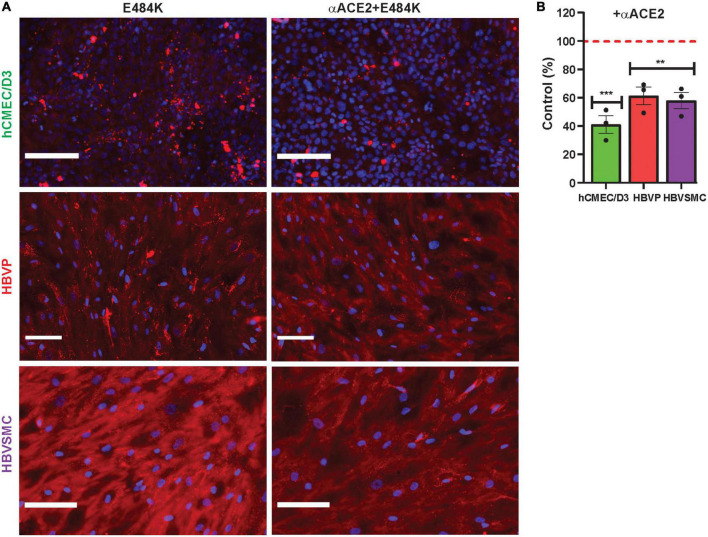
FIGURE 6.
Anti-ACE2 suppressed mutant SARS-CoV-2/SP E484K uptake by cerebrovascular cells. (A,B) Excess unlabeled αACE2 suppressed labeled SP-555 E484K uptake in the hCMEC/D3 cells, HBVP, and HBVSMC compared to controls in the absence of unlabeled αACE2 for each cell type. Red dashed line is control levels in the absence of αACE2 (100%). Values are mean ± SEM. N = number of data points (wells) shown with the histogram. Scale bar = 100 μm. Supplementary Figure 7. **P < 0.01; ***P < 0.001.

