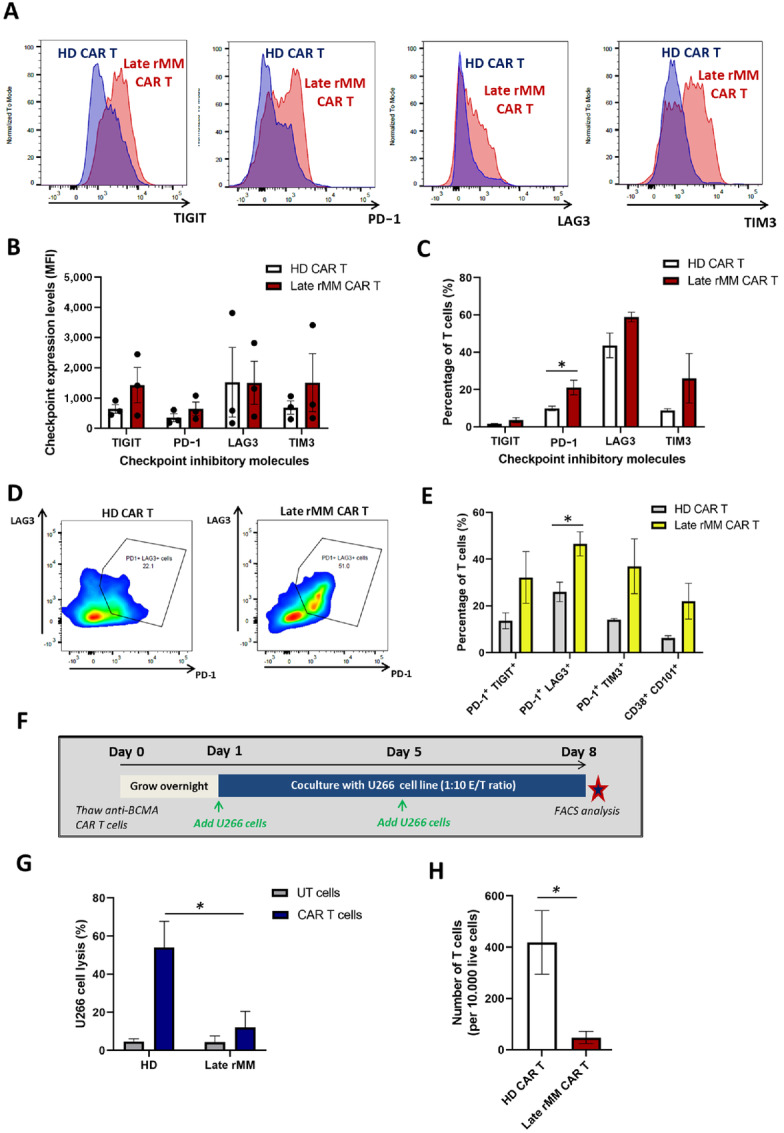
FIGURE 3.

HD-derived anti-BCMA CAR T cells express lower levels of PD-1, TIGIT and LAG3 compared with multiple myeloma–derived anti-BCMA CAR T cells and show superior cytotoxicity in a rechallenge assay. A, Representative histograms comparing the expression of the T-cell checkpoint inhibitory molecules TIGIT, PD-1, LAG3, and TIM3 on HD-derived (blue) versus multiple myeloma (MM)-derived (red) anti-BCMA CAR T cells, analyzed by FACS at the end of production (day 14, before cryopreservation). B, Quantitation of MFI of TIGIT, PD-1, LAG3, and TIM3 across HD-derived (n = 3) and late rMM-derived (n = 3) anti-BCMA CAR T-cell samples. C, Percentage of TIGIT+, PD-1+, LAG3+, and TIM3+ on anti-BCMA CAR T cells from HD (n = 3) versus late rMM patients (n = 3) at the end of production (day 14). D, Representative density plots depicting the expression of the checkpoint inhibitory molecules PD-1 and LAG3 on HD-derived versus late rMM–derived anti-BCMA CAR T cells, analyzed by FACS and gated on PD-1+LAG3+ double expression. E, Percentage of HD-derived versus late rMM–derived anti-BCMA CAR T cells expressing PD-1+TIGIT+, PD-1+LAG3+, PD-1+TIM3+ and the permanently dysfunctional CD38+CD101+ T-cell population. F, Schematic diagram describing the cytotoxicity rechallenge assay consisting of a prolonged coculture of anti-BCMA CAR T cells and the multiple myeloma cell line U266, using a 1:10 E/T ratio. U266 cells were added to the anti-BCMA CAR T cells twice, on days 1 and 5. The coculture assay wells were analyzed by FACS on day 8. UT cells were used to measure T-cell background killing. G, Percentage of U266 cell lysis (day 8) when cocultured with HD-derived UTs (n = 3) or HD-derived anti-BCMA CAR T cells (n = 3) versus late rMM–derived UTs (n = 3) or late rMM–derived anti-BCMA CAR T cells (n = 3), analyzed by FACS using the viability dye e450. H, T-cell expansion of HD-derived (n = 3) versus late rMM–derived (n = 3) anti-BCMA CAR T cells at the end of the rechallenge assay (analyzed by FACS). Data represent mean values ± SEM. *P < 0.05. Statistical analysis was performed using two-tailed unpaired t test.
