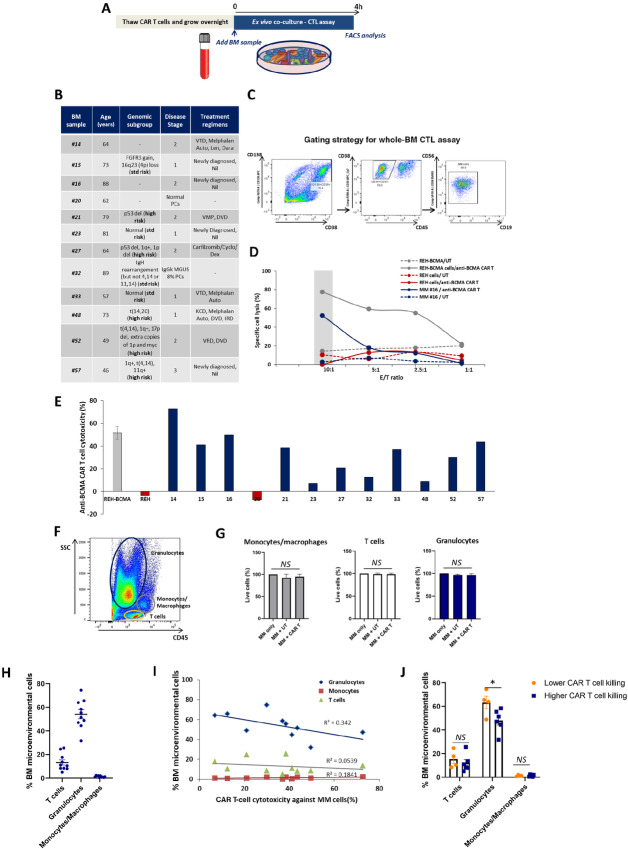
FIGURE 4.
HD-derived anti-BCMA CAR T cells specifically and efficiently target multiple myeloma (MM) primary cells within the BM microenvironment of different patient subgroups. A, Schematic timeline of the ex vivo cytotoxicity (CTL) assay using BM samples from patients with multiple myeloma to test the activity of HD-derived anti-BCMA CAR T cells. The coculture was performed for 4 hours at different E/T ratios. BM samples were always used fresh and the available volume varied from sample to sample, which limited the number of samples used in specific assays. B, Table describing the clinical features of the patients with multiple myeloma used in this assay (n = 11), including patient age, genomic subgroup, disease stage, and prior treatment regimens. BM sample #20 is an age-matched normal plasma cell control with no detectable multiple myeloma cells in the BM. C, Representative dot plots describing the gating strategy used by FACS to identify multiple myeloma cells within the BM sample after staining with the multiple myeloma antibody panel. Multiple myeloma cells are sequentially gated as CD138+/CD38hi, CD38hi/CD45− and CD56+/CD19−. D, Specific cancer cell lysis of MM#16 primary cells after coculture with anti-BCMA CAR T cells (continuous line) or UT cells (dotted line) at different E/T ratios. REH cell line and REH-BCMA+ cell line were used as negative and positive controls, respectively. UT cells were used to measure background T-cell killing. E, Specific anti-BCMA CAR T-cell killing (%) against different BM samples (n = 12) after the ex vivo CTL assay at 10:1 E/T ratio. The anti-BCMA CAR T-cell killing percentage was quantified as: [(%multiple myeloma cell lysis cocultured with anti-BCMA CAR T cells − % multiple myeloma cell lysis cocultured with UT cells) / % spontaneous multiple myeloma cell lysis]. REH and REH-BCMA were used as negative and positive controls, respectively. F, Representative FACS plot of a BM sample using the SSC/CD45 gating strategy to identify the different BM cell types present, including: granulocytes, monocytes/macrophages, and T cells. G, Cell viability of monocytes/macrophages, T cells, and granulocytes present within the multiple myeloma BM samples (n = 11) after the ex vivo CTL assay with UT cells or anti-BCMA CAR T cells. H, Percentage of BM microenvironmental cells (T cells, granulocytes, and macrophages/monocytes) present in the multiple myeloma BM samples prior to the ex vivo CTL assay (n = 10). I, Correlation between % BM microenvironmental cells and CAR T-cell cytotoxic activity for each multiple myeloma sample (n = 10). J, Percentage of BM microenvironmental cells (T cells, granulocytes, and macrophages/monocytes) present in samples with lower CAR T-cell killing (below CAR T-cell killing average of 32.9%) versus higher CAR T-cell killing (above CAR T-cell killing average of 32.9%). Data represent mean values ± SEM. NS, not statistically significant; *P < 0.05. Statistical analysis was performed using two-tailed unpaired t test. Abbreviations: Auto, Autologous stem cell transplant/autograft; Cyclo, Cyclophosphamide; Dara, Daratumumab; Dex, Dexamethasone; DVD, Daratumumab, Velcade, Dexamethasone; IRD, Ixazomib, Lenalidomide, Dexamethasone; Len, Lenalidomide; KCD, Carfilzomib, Cyclophosphamide, Dexamethasone; Nil, no prior treatment regimen; VMP, Velcade, Melphalan, Prednisolone; VTD, Velcade, Thalidomide, Dexamethasone.

