FIGURE 5.
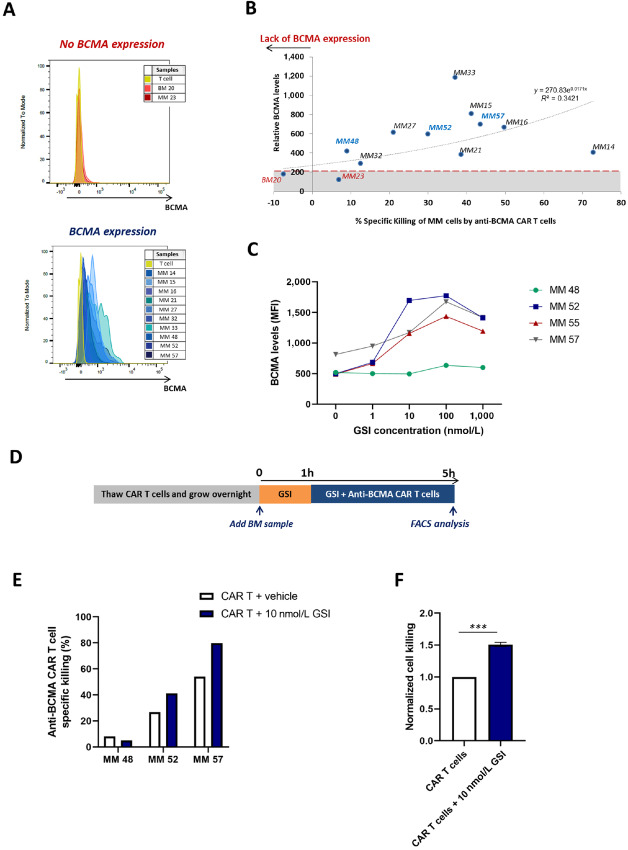
Anti-BCMA CAR T-cell activity can be enhanced by increasing BCMA levels on the multiple myeloma (MM) cell surface. A, Histograms showing the BCMA expression of multiple myeloma primary cells from each BM sample, analyzed by FACS. The age-matched normal BM20 control and the MM23 primary cells are BCMA− according to a T-cell internal control. All the other multiple myeloma samples express BCMA at varying levels. B, Correlation between specific anti-BCMA CAR T-cell activity and BCMA expression for each BM sample analyzed (n = 12). The relative BCMA expression (mean fluorescence intensity, MFI) was normalized to the BCMA expression on BM endogenous T cells, used as an internal negative control. C, Expression levels of BCMA (MFI) on multiple myeloma primary cells (MM48, MM52, MM55, MM57) after treatment with GSI PF-03084014 for five hours at different concentrations. D, Diagram illustrating the experimental timeline used to combine the treatment of GSI PF-03084014 with anti-BCMA CAR T cells in the ex vivo CTL assay with multiple myeloma BM samples. BM samples were always used fresh and the available volume varied from sample to sample, which limited the number of samples used in specific assays. E, Specific killing of MM48, MM52, and MM57 cancer cells by anti-BCMA CAR T cells or UT cells, with and without GSI treatment. F, Normalized cell killing of anti-BCMA CAR T cells against MM52 and MM57 primary cells (n = 2) with or without 10 nmol/L of GSI treatment. Values normalized to the specific killing of anti-BCMA CAR T cells only. ***P < 0.005. Statistical analysis was performed using one-tailed paired t test.

