. 2023 Feb 17;12:e81850. doi: 10.7554/eLife.81850

Figure 2. Z-scores of allosteric pockets and probabilities of ranking an allosteric pocket in the top 3.

(A) The sequence lengths of all proteins in our data set. (B) The number of homologous sequences. Neff represents the number of effective homologous sequences obtained under 80% reweighting. (C) Z-scores of allosteric pockets on proteins in the data set. Among the 25 allosteric pockets, the Z-scores of 23 allosteric pockets were greater than 0.5. (D) The probabilities that the known allosteric pockets were ranked in the top 1, top 2, and top 3.

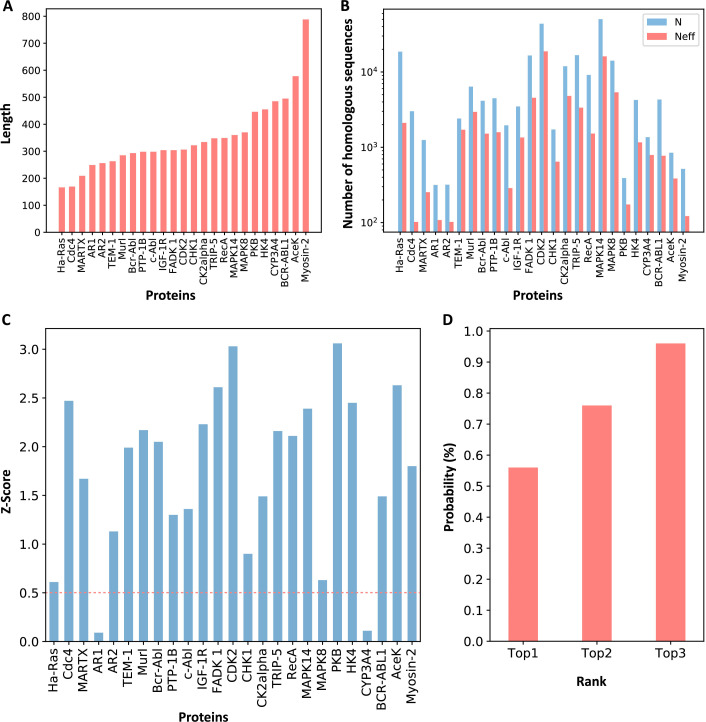
Figure 2—source data 1. Raw data for Figure 2.

Figure 2.

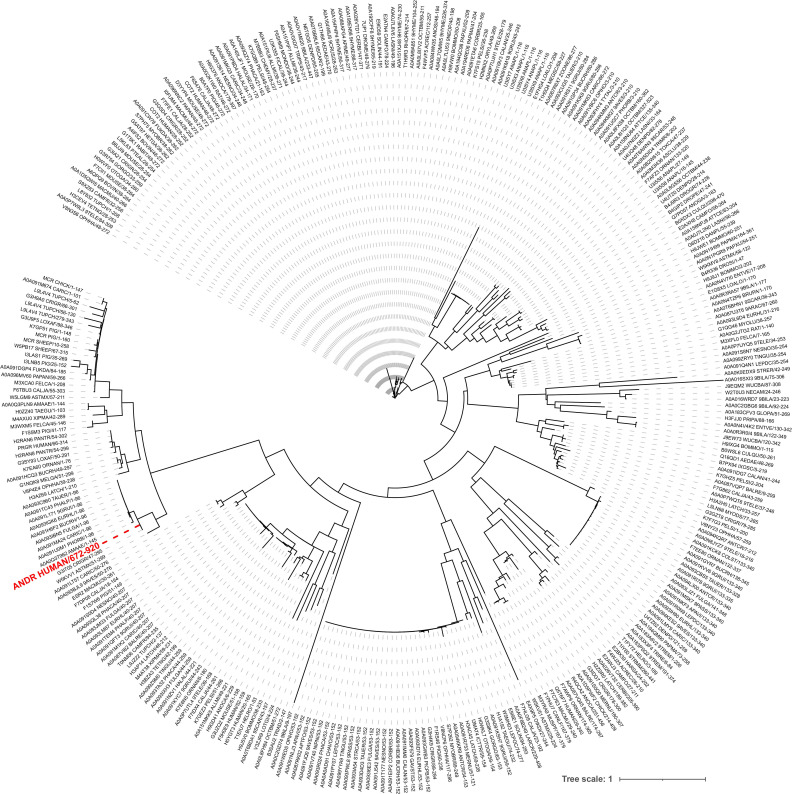
Figure 2—figure supplement 1. Phylogenetic tree of the androgen receptor.

Figure 2—figure supplement 1.

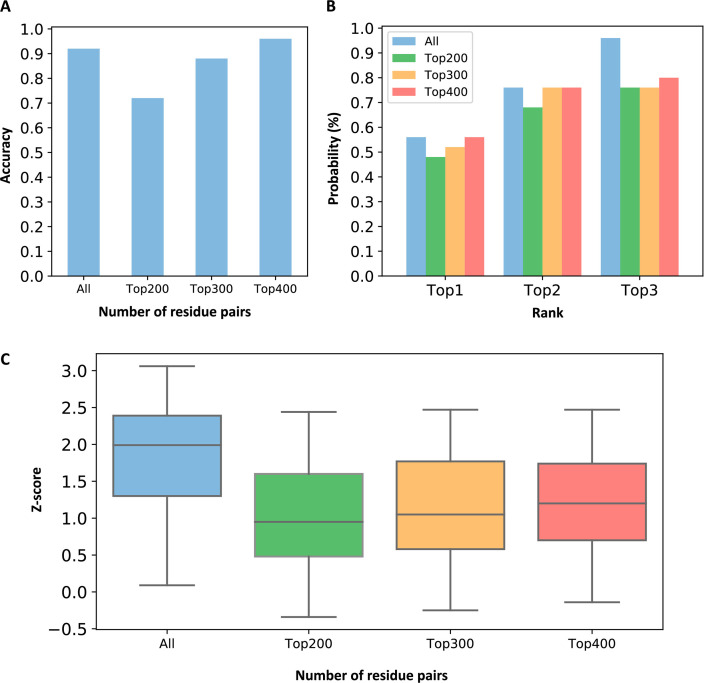
Figure 2—figure supplement 2. Comparison of evolutionary coupling strength between pockets when all residue pairs and partial residue pairs were used.

Figure 2—figure supplement 2.

(A) Prediction accuracy of using different numbers of residue pairs. We defined that the criterion for successful prediction is that the Z-score of the allosteric pocket is greater than 0.5. (B) The probabilities that the known allosteric pockets were ranked in the top 3 when using different numbers of residue pairs. (C) The distribution of Z-scores for the allosteric pockets when different numbers of residue pairs were used.
Figure 2—figure supplement 2—source data 1. Raw data for Figure 2—figure supplement 2.
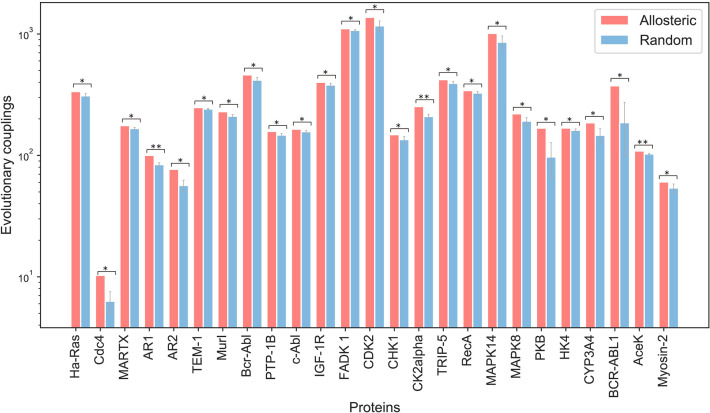
Figure 2—figure supplement 3. Difference between the evolutionary coupling between orthosteric and allosteric sites and the evolutionary coupling between two random patches.

Figure 2—figure supplement 3.

Two residues that are not part of the orthosteric and allosteric sites were randomly selected from the surface residues of proteins. Among them, one was taken as the first center, and the residues around it with the same number as the residues in orthosteric pocket were selected as patch1; and the other residue was taken as the second center, and the residues around it with the same number as the residues in allosteric pocket were selected as patch2. Then we calculated the evolutionary coupling strength between patch1 and patch2. The process was repeated four times, and the mean and standard deviation of the evolutionary coupling strength were calculated. Finally, we compared the evolutionary coupling strength between patch1 and patch2 with that between orthosteric and allosteric sites by using the student’s t-test. If the p value was less than 0.05, we marked it with an asterisk; if the p value was less than 0.01, we marked it with two asterisks.
Figure 2—figure supplement 3—source data 1. Raw data for Figure 2—figure supplement 3.