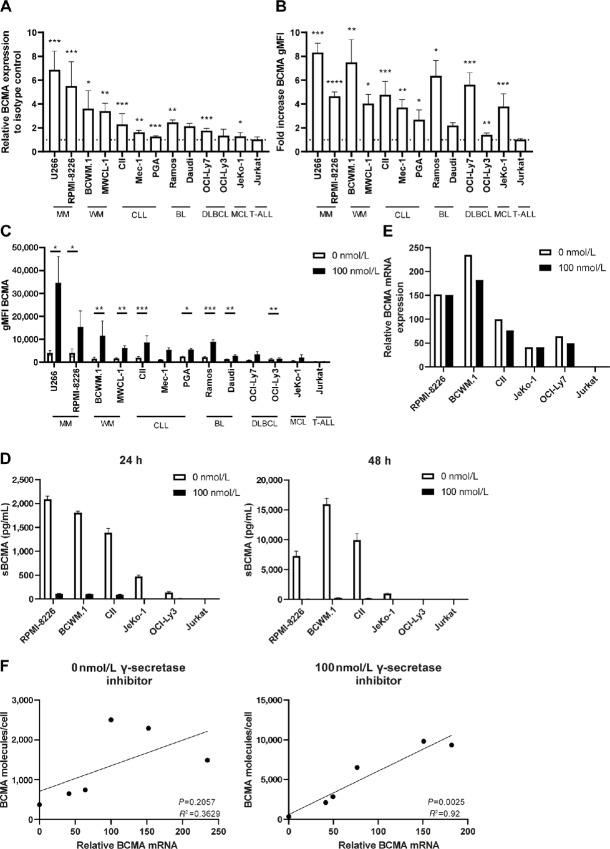
FIGURE 1.
BCMA is expressed by different B-cell malignancies and can be enhanced by γ-secretase inhibition. A, B-cell malignancy cell lines were cultured and basal levels of BCMA were assessed by flow cytometry and compared with isotype controls (n = 3–8). Dotted line indicates no increase compared with isotype control. B, Cell lines were treated for 24–48 hours with 100 nmol/L γ-secretase inhibitor or with medium control and BCMA was assessed by flow cytometry. Values are represented as fold increase compared with 0 nmol/L γ-secretase inhibitor (n = 3–12). Dotted line indicates no increase compared with 0 nmol/L γ-secretase inhibitor. C, Cell lines were cultured for 24 hours with 100 nmol/L γ-secretase inhibitor or with medium control and BCMA was assessed by flow cytometry. Values are molecules/cell as quantified using PE Fluorescence Quantitation Kit (n = 3–12). D, Assessment of soluble BCMA by ELISA in supernatants of B-cell malignancy cell lines after treatment with 0 or 100 nmol/L γ-secretase inhibitor for 24–48 hours (n = 2). E, Assessment of BCMA mRNA relative to GAPDH control by qPCR after B-cell malignancy cell lines were treated without or with 100 nmol/L γ-secretase inhibitor for 24 hours. F, Correlation between BCMA membrane expression and BCMA mRNA expression in B-cell malignancy cell lines without γ-secretase inhibition or with 100 nmol/L γ-secretase inhibition for 24 hours. The P value was calculated by paired t test or Wilcoxon test (A–C) or simple linear regression (E). In A, P values were calculated compared with isotype controls. In B, P values were calculated compared with 0 nmol/L γ-secretase inhibitor. Data are presented as mean ± SD. *, P < 0.05; **, P < 0.01; ***, P < 0.001; ****, P < 0.0001.

