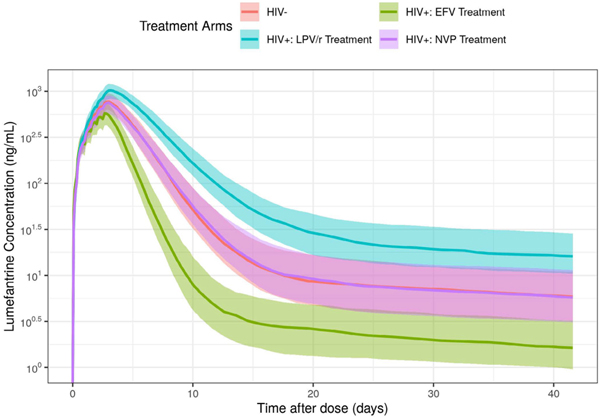
Figure 1.
Simulated lumefantrine concentration over time for patients with and without ART. The lines represent the median predicted lumefantrine concentration and the shaded regions represent the 30% prediction interval (i.e., from the 35th to 65th percentiles) of the median. ART, antiretroviral therapy; EFV, efavirenz.

