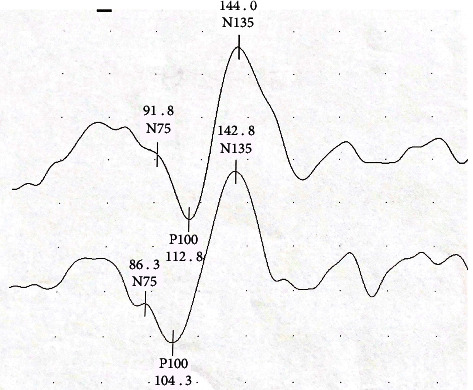
Figure 1.

A waveform sample from PD group. VEP amplitude, N75, N135, and P100 latencies for the right and left eyes were measured. The upper waveform was obtained from the right eye and the lower waveform was obtained from the left eye. (Latencies are given in milliseconds (ms) and amplitudes in microvolts (μV). Between two points in the vertical direction represent 2 μV, peak-to-peak amplitude of the P wave are 7.66 μV on the upper wave and 7.33 μV on the lower wave, respectively).
