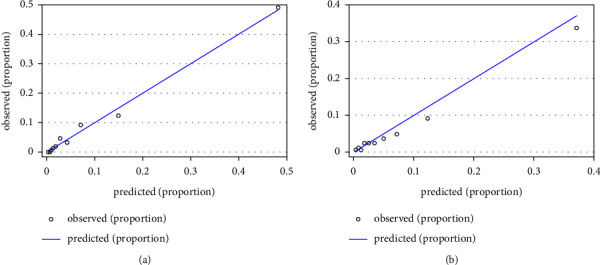
Figure 2.

The Hosmer-–Lemeshow calibration curve for the model predicting probability of NOAF in ACS patients. (a) Calibration curve for the model in the training cohort; (b) the calibration curve for the model in the validation cohort. X-axis is predicted probability by model and y-axis is actual probability of NOAF.
