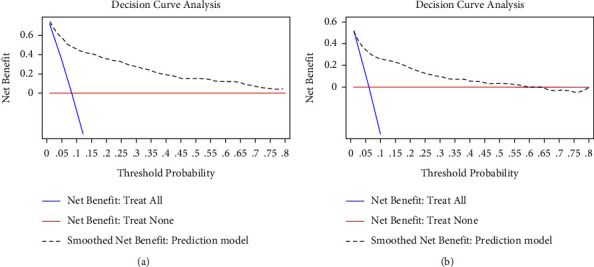
Figure 3.

The decision curve analysis (DCA) for the model predicting probability of NOAF in ACS patients. (a) DCA for the model in the training cohort; (b) the DCA for the model in the validation cohort. The decision curve of the prediction model is composed of an X-axis which represents continuum of potential thresholds for NOAF risk and a Y-axis which represents the net benefit which is obtained by dividing the net true positives by the sample size. The blue curve “net benefit: treat all” shows the net benefit if all ACS patients were intervened for NOAF. The red line “net benefit: treat none” shows the net benefit if no ACS patients were intervened for NOAF. The black dotted line “prediction model” curve shows the net benefit if it is used to select patients for NOAF intervention. For example, if the personal threshold probability of a patient was 40%, the net benefit would be 0.2 when using the prediction model to decide whether to intervene NOAF, which means that there are 20 net detected NOAF per 100 patients.
