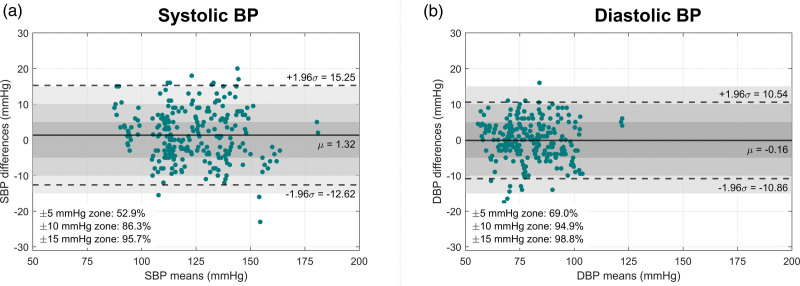
Fig. 2.
Bland–Altman plots comparing (a) SBP and (b) DBP measurements performed by the Aktiia cuff and the reference double-auscultation. ROIs within ±5 mmHg, ±10 mmHg and ±15 mmHg are highlighted in dark grey and light grey, respectively. The percentage of agreement for each region is shown on the bottom left of the Bland–Altman plots. The solid black line denotes the average mean of differences, while the dotted lines denote the limits of agreement (±1.96σ). ROIs, regions of interest.

