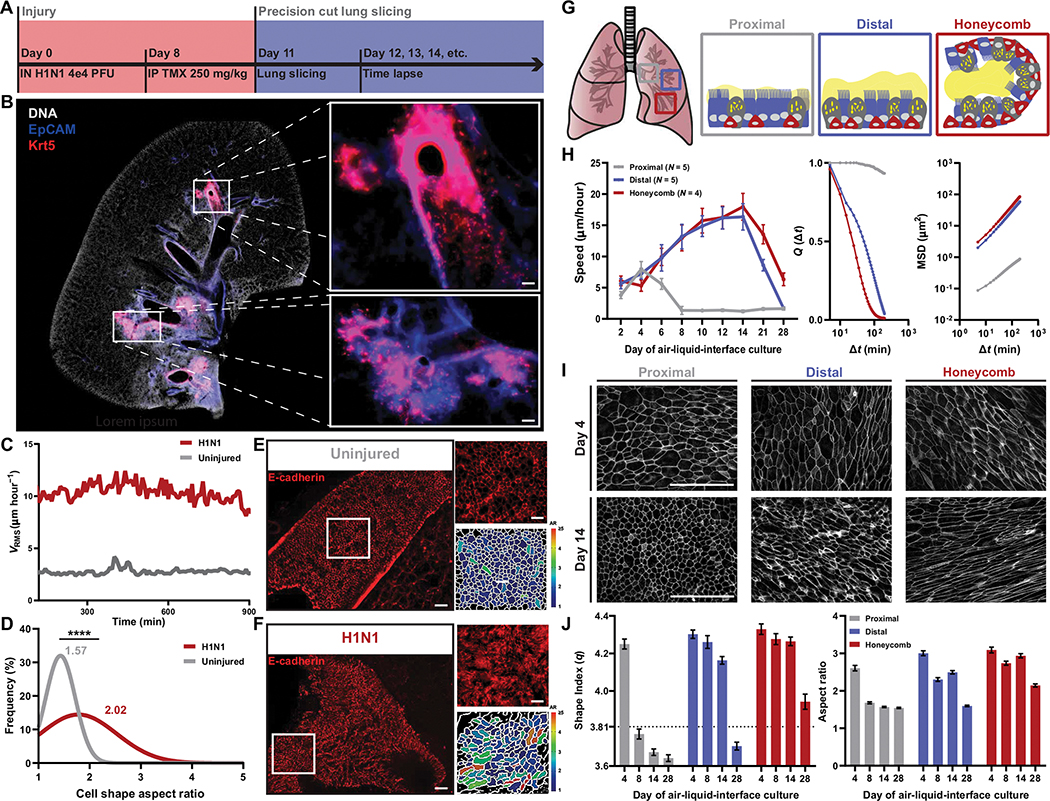
Fig. 1. Mouse and human airways share epithelial fluidization during repair.
(A) Timeline of Krt5-TdTomato mouse injury model and precision cut lung slicing. (B) Representative image of H1N1-injured mouse lung. Immunofluorescence staining of 4′,6-diamidino-2-phenylindole (DAPI; white), epithelial cells marked by EpCAM (blue), and Krt5+ cells (red) in the distal airways. Scale bars, 100 μm. (C) Mean root mean squared velocity (VRMS) of uninjured and H1N1-injured mouse airways. (D) Histogram of cellular aspect ratio (AR) of mouse airways from uninjured and injured mice. Mann-Whitney test used for statistical comparison. (E and F) Representative images of E-cadherin–stained mouse airways with corresponding AR segmentation. Scale bars, 100 μm. (G) Schematic of intra-airway epithelial cell isolation from patients with IPF. (H) Speed of proximal, distal, and honeycomb cultures across 28 days of air-liquid interface (ALI) with overlap parameter (Q) and mean squared displacement (MSD) measurements from day 14 of ALI. Error bars represent 95% confidence interval. (I) Representative images of F actin–stained proximal, distal, and honeycomb regions at early (day 4) and late (day 14) days of ALI. Scale bars, 100 μm. (J) Quantification of the epithelial shape index and AR from proximal, distal, and honeycomb regions across 28 days of ALI culture. Dashed line represents shape index of 3.81, the theoretical threshold between fluid and solid phases. Error bars represent 95% confidence interval. (A to J) For all statistical analysis, ****P < 0.0001. Mouse experiments were independently performed N ≥ 2 times with n ≥ 4 animals. Epithelial culture experiments were independently performed N ≥ 3 times with n ≥ 4 donors.

